Fig. 5
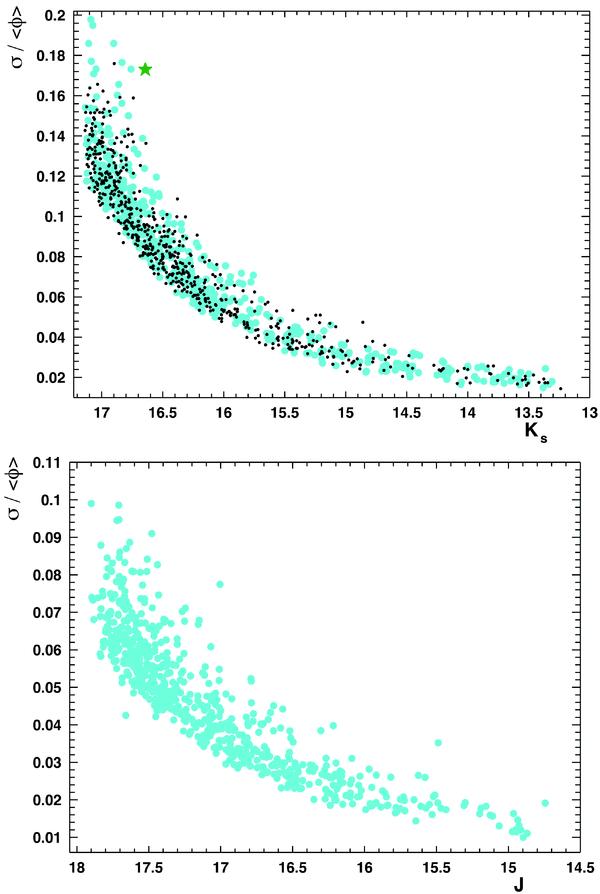
Dispersion of the photometric measurements along the light-curves as a function of the mean Ks magnitude (up) and J magnitude (down). Each dot corresponds to one light-curve. In the upper panel, the small black dots correspond to control stars that are not behind the gas; the big blue dots correspond to stars located behind the gas; the big star marker indicates our selected candidate.
Current usage metrics show cumulative count of Article Views (full-text article views including HTML views, PDF and ePub downloads, according to the available data) and Abstracts Views on Vision4Press platform.
Data correspond to usage on the plateform after 2015. The current usage metrics is available 48-96 hours after online publication and is updated daily on week days.
Initial download of the metrics may take a while.