| Issue |
A&A
Volume 525, January 2011
|
|
|---|---|---|
| Article Number | A29 | |
| Number of page(s) | 6 | |
| Section | Catalogs and data | |
| DOI | https://doi.org/10.1051/0004-6361/201015223 | |
| Published online | 29 November 2010 | |
Identification of blue high proper motion objects in the Tycho-2 and 2MASS catalogues using Virtual Observatory tools
1
Centro de Astrobiología (INTA-CSIC), Departamento de
Astrofísica, PO Box
78, 28691
Villanueva de la Cañada,
Madrid,
Spain
e-mail: This email address is being protected from spambots. You need JavaScript enabled to view it.
2
Spanish Virtual Observatory,
Spain
3
Saint Louis University, Madrid Campus, Division of Science and
Engineering, Avenida del Valle
34, 28003
Madrid,
Spain
4
Centro de Astrobiología (INTA-CSIC), Departamento de
Astrofísica, Carretera de Ajalvir
km 4, 28850
Torrejón de Ardoz,
Spain
Received: 16 June 2010
Accepted: 12 September 2010
Abstract
Aims. With available Virtual Observatory tools, we looked for new bright blue high proper motion objects in the entire sky: white dwarfs, hot subdwarfs, runaway OB stars, and early-type stars in nearby young moving groups.
Methods. We performed an all-sky cross-match between the optical Tycho-2 and near-infrared 2MASS catalogues with Aladin, and selected objects with proper motions μ > 50 mas yr-1 and colours VT − Ks < −0.5 mag with TOPCAT. We also collected multi-wavelength photometry, constructed the spectral energy distributions and estimated effective temperatures from fits to atmospheric models with VOSA for the most interesting targets.
Results. We assembled a sample of 32 bright blue high proper motion objects, including ten sdO/B subdwarfs, nine DA white dwarfs, five young early-type stars (two of which are runaway stars), two blue horizontal branch stars, one star with poor information, and five objects reported for the first time in this work. These last five objects have magnitudes BT ≈ 11.0–11.6 mag, effective temperatures Teff ≈ 24000–30 000 K, and are located in the region of known white dwarfs and hot subdwarfs in a reduced proper motion-colour diagram. We confirmed the hot subdwarf nature of one of the new objects, Albus 5, with public far-ultraviolet spectroscopic data obtained with FUSE.
Key words: astronomical databases: miscellaneous / virtual observatory tools / stars: early-type / stars: peculiar / subdwarfs / white dwarfs
© ESO, 2010
1. Introduction
Bright objects with blue colours and high proper motions are rare in the sky. By “bright” we mean sources with optical magnitudes in the range covered by classical astronomical catalogues, such as the Bonner Durchmusterung (Schonfeld 1886; Argelander 1903), Córdoba Durchmusterung (Thome 1894), Henry Draper (Cannon & Pickering 1925, and previous versions), or the most recent Hipparcos (Perryman et al. 1997) and Tycho-2 (Høg et al. 2000) catalogues. These catalogues typically have higher limit magnitudes between 9 and 11 mag in the visible. Blue colours are indicative of high effective temperatures, while high proper motions of tens of mas yr-1 imply short heliocentric distances or large tangential velocities at moderate distances.
There are few possible kinds of bright blue high proper motion objects. They can be nearby white dwarfs, hot subdwarfs, runaway OB stars, or early-type stars in nearby young moving groups. Most of the known blue objects (e.g., massive early-type stars in massive clusters) in the Galaxy are located far away and, therefore, have low proper motions and are apparently faint save for a few exceptions. Likewise, a wealth of objects with high proper motions are known, but the bulk of them are neighbouring late-type stars with red colours. Blue extragalactic objects are also known, but they present a negligible proper motion.
Bright blue high proper motion objects are important for many fields in astrophysics. Bright white dwarfs and hot subdwarfs, for instance, are extensively used as spectrophotometric standard stars (Stone 1977; Oke & Gunn 1983; Oke 1990), class prototypes, or as tracers of the Population II in the Galaxy. Their apparent high optical brightnesses facilitate the determination of physical parameters at extreme conditions (very high temperatures and gravities) in a relatively undemanding way. Similarly, runaway OB stars and early-type stars in young moving groups are fundamental for understanding the evolution and evaporation of star-forming regions.
In this paper, we used Tycho-2 and the Two Micron All Sky Survey Point Source (2MASS; Skrutskie et al. 2006) catalogues and Virtual Observatory tools to look for the bluest objects (VT − Ks ≤ −0.5 mag) with the highest proper motions (μ > 50 mas yr-1).
2. Analysis and results
2.1. Tycho-2/2MASS cross-match
On the one hand, Tycho-2 gives position and proper motion information for the 2.5 million brightest stars in the sky. Photometric data for two pass-bands (BT and VT, close to Johnson B and V; Perryman et al. 1997) are also provided. Typical uncertainties are 60 mas in position, 2.5 mas yr-1 in proper motion, and 0.1 mag in photometry. On the other hand, 2MASS contains photometric data for 471 million sources in the J, H, and Ks near-infrared bands. Typical photometric and astrometric uncertainties of 2MASS are less than 0.03 mag and 100 mas, respectively.
In this work we took advantage of Virtual Observatory1 (VO) tools to cross-match the whole Tycho-2 and 2MASS catalogues. The VO is a project designed to provide the astronomical community with the data access and the research tools necessary to enable the exploration of the digital, multi-wavelength universe resident in the astronomical data archives. In particular, we made use of the scripting capability of Aladin2 (Bonnarel et al. 2000) to perform our cross-match, a VO-compliant software that allows users to visualise and analyse digitised astronomical images, and superimpose entries from astronomical catalogues or databases available from the VO services. To avoid memory overflow during data processing, we divided the full sky sphere into overlapping circular regions of 4.5 deg2. The useful and powerful Aladin script mode allowed us to readily perform the following workflow for each region:
-
Select all Tycho-2 sources with proper motion μ > 50 mas yr-1.
-
Select all 2MASS sources within a radius of 40 arcsec around each selected high proper motion Tycho-2 source.
-
Convert 2MASS coordinates into J2000.0 epoch using the proper motion of the related Tycho-2 source.
-
Select for each Tycho-2 source the nearest proper motion-corrected 2MASS source.
During the cross-match process, we imposed a good quality flag (Qflg = A, B, C, or D) in Ks and an error lower than 0.3 mag in VT. It returned more than 300 000 identifications. However, because we worked with overlapping regions, an important fraction of the identifications were duplicated. We used TOPCAT3 to purge the duplicated data and to carry out the subsequent analyses. TOPCAT is an interactive graphical viewer and editor for tabular data that allows the user to examine, analyse, combine, and edit astronomical tables. After purging the data we ended with a sample of 157 184 sources fulfilling all the above criteria.
In Fig. 1 we show the histograms of angular separations ρ between the cross-matched Tycho-2 and 2MASS proper motion-corrected sources, in both directions, right ascension and declination. Most of the separations (98.3%) are lower than 0.50 arcsec. Quantitatively, the mean angular separation and standard deviation are  arcsec and σρα = 0.23 arcsec for the right ascension, and
  arcsec and σρδ = 0.26 arcsec for the declination. Thus, we discarded 1800 (spurious) matches with separations higher than 3σρ in any of the spatial directions, which reduced the total number of sources to 155 384.
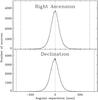 |
Fig. 1 Histograms of the angular separation in right ascension (upper panel) and declination (lower panel) between the Tycho-2 and the closest 2MASS counterpart, after correcting the 2MASS coordinates for Tycho-2 proper motion. The vertical dashed lines indicate the maximum separation allowed for a reliable cross-match, 3σρα = 0.69 arcsec in right ascension, and 3σρδ = 0.78 arcsec in declination. |
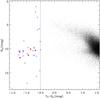 |
Fig. 2 Reduced proper motion diagram (HVT versus VT − KS). Selected objects are bluewards of the dashed vertical line at VT − Ks = −0.5 mag. Previously unreported blue high proper motion objects are depicted with (red) filled circles. Already known blue high proper motion objects are shown with (blue) open symbols: hot subdwarfs with squares, white dwarfs with diamonds, young main-sequence stars with up-triangles, and other stars with down-triangles. Objects redder than VT − Ks = −0.5 mag are marked with (black) small dots. |
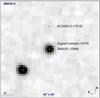 |
Fig. 3 Verification of the high proper motion of Albus 4 (TYC 6017–419–1), a representative blue high proper motion object, in a Ks-band 2MASS image. The epochs of observation in the AC2000.2 (blue diamond), SuperCOSMOS (red square), and 2MASS (yellow circles) are shown in parenthesis. The DENIS epoch almost coincides with the 2MASS one. |
2.2. Colour selection
We show the reduced proper motion-colour diagram of the cross-matched sources in Fig. 2. The reduced proper motion, HVT, is defined as HVT = VT + 5 log μ + 5, where μ is the proper motion in arcseconds per year. It can also be expressed as HVT = MVT + 5 log νt − 3.3, where MVT is the VT-band absolute magnitude and νt is the transverse velocity in kilometers per second. The VT − Ks colour is a suitable effective-temperature indicator in field objects. The reduced proper motion diagram therefore constitutes a powerful tool for segregating members of kinematically-distinct stellar populations (e.g. Lépine & Shara 2005). In particular, it is possible to distinguish three types of objects from Fig. 2: Population I (upper branch), Population II stars (middle branch) and white dwarfs (very tiny lower branch).
For selecting blue high proper motion candidates, we applied a very simple selection criterion: VT − Ks < −0.5 mag, depicted in Fig. 2 with a vertical dashed line. In total, 33 objects showed bluer colour than this value. This simple selection criterion produced an appropriate number of sources that could be studied in detail in a reasonable time scale.
2.3. Visual inspection, object rejection, and final sample
We visually inspected the 33 selected blue high proper motion candidates with Aladin. We compared and blinked two sets of images separated several decades in time, optical DSS-1 and near-infrared 2MASS, to easily confirm the high proper motion of our candidates. The Tycho-2 sources and 2MASS counterparts were superimposed on the images to assess the reliability of the cross-match. Besides, we used other available astro-photometric databases, such as the Astrographic Catalogue AC2000.2 (Urban et al. 1998), USNO-B1 (Monet et al. 2003), SuperCOSMOS Sky Survey (Hambly et al. 2001), DENIS (Epchtein et al. 1997) and the Positions and Proper Motions-Extended PPMX (Röser et al. 2008), to verify the high proper motion (Fig. 3).
Of the 33 blue high proper motion candidates, we discarded TYC 8250–687–1, for which Tycho-2 provided an erroneous proper motion after mixing the star 2MASS 13052225–4740536 (V < 10 mag) with the close (ρ ≈ 14 arcmin) bright extended galaxy 2MASX 13052358–4740500 (z = 0.01731 ± 0.00015; Crook et al. 2007).
Already known bright blue high proper motion objects.
New bright blue high proper motion objects.
Of the 32 remaining objects, 27 were already known. We list their basic properties in Table 1. Among them are most of the known brightest white dwarfs and hot subdwarfs. Besides, there are runaway OB stars, early-type stars in young moving groups, and one chemically-peculiar halo blue horizontal branch star. Several of them have their trigonometric parallaxes measured by the Hipparcos satellite (van Leeuwen 2007). The trigonometric parallaxes of white dwarfs are larger than those of hot subdwarfs, which indicates longer heliocentric distances and higher luminosities for the latter, consistent with their classification.
The remaining five objects, listed in Table 2, have never before been reported in the literature. For naming them, we followed the “Albus” nomenclature introduced by Caballero & Solano (2007) and followed in Caballero (2009). Our new Albus objects go from the fourth to the eighth of this series.
3. Discussion
The five new bright blue high proper motion objects (Table 2) are placed in the reduced proper motion-colour diagram (Fig. 2) in the region at which hot subdwarfs and early-type white dwarfs gather. To shed some light into the nature of the new Albus objects, we searched for additional photometric data with the “all-VO” utility of Aladin. This utility allows the user to query a large number of photometric catalogues in a comfortable way. Besides Tycho-2 and 2MASS, two others catalogues had additional photometric data: DENIS and GRIZ (Ofek 2008). DENIS gives magnitudes in the i band for the three Albus sources in the Southern hemisphere, whereas the GRIZ catalogue provides synthetic SDSS griz magnitudes for all new Albus sources but Albus 6 (see Table 2). The typical uncertainty for the GRIZ photometry is about 0.12, 0.12, 0.10, and 0.08 mag (1σ), for the g, r, i, and z-bands, respectively.
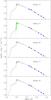 |
Fig. 4 Theoretical fitting of the Albus SEDs. Solid lines represent the Kurucz models that best fits the observational data. Filled (blue) and open (red) circles indicate the photometric data used for the fit and the synthetic GRIZ photometry data used for control, respectively. The thin (green) line in the second panel depicts the ultraviolet FUSE spectra of Albus 5. |
We took advantage of another VO-tool, VOSA4 (VO Sed Analyzer) to fit the observed spectral energy distributions (SEDs) to theoretical models. The VOSA allows the user to query in an automatic and transparent way different collections of theoretical models, to calculate their synthetic photometry, and to perform a statistical test to determine which model best reproduces the observed data. To fit the SEDs of our Albus objects, we used only the observational data (all but the GRIZ ones) and fitted them to Kurucz stellar atmosphere models (Castelli et al. 1997). The effective temperatures Teff obtained with VOSA ranged between 24 000 and 30 000 K (see Table 2). The accuracy of the effective temperature estimated with this method is defined by the step of the grid of the model, 1000 K in this case. In Fig. 4 we have plotted the theoretical fitting of the observational SEDs.
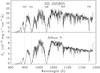 |
Fig. 5 FUSE spectra of the sdB star HD 205805 (upper panel) and Albus 5 (lower panel). The strongest observed lines (e.g. of the Lyman series) and multiplets (e.g. C iii) have been labelled. |
The confirmation of the real nature of these objects requires spectroscopic data. To look for spectra in the VO archives, we used another VO-tool, VOSED5. Developed by the Spanish Virtual Observatory, VOSED allows the user to gather spectroscopic information available throughout the VO. Only Albus 5 was found to have spectroscopic data. In particular, it was observed by the Far Ultraviolet Spectroscopic Explorer (FUSE) as part of the programme G061. We used this spectrum to confirm its hot subdwarf nature. In Fig. 5 we compare the FUSE spectra of Albus 5 to the well known sdB star HD 205805 (Teff ≳ 26 000 K; Baschek & Norris 1970). The two spectra are almost identical, showing a huge number of photospheric and interstellar absorption lines that are observed in the FUSE spectra of almost all sdB stars (Chayer et al. 2006). Because of the strong similitude of these two ultraviolet spectra and the Teff of 24 000 K obtained using VOSA, we classify Albus 5 as a bona-fide sdB star. The other four objects have equal or higher Teff (and bluer VT − Ks colours) and could be either sdO/B subdwarfs or early-type white dwarfs. Knowing their trigonometric parallaxes would help to classify them. Unfortunately, neither of the five new Albus are included in the Hipparcos catalogue.
4. Summary
To find out blue high proper motion objects, we cross-matched the 2.5 million sources in the Tycho-2 catalogue with the 471 million sources in the 2MASS catalogue. From this correlation, and after discarding one erroneous identification, we obtained a sample of 32 objects with proper motions larger than 50 mas yr-1 and VT − Ks colours bluer than −0.5 mag. Of these, 27 were known and five (Albus 4 to 8) were studied here for the first time.
From the position of the new discovered sources in a reduced proper motion-colour diagram and theoretical fitting of their SEDs, we concluded that these objects are probably hot subdwarfs or early-type white dwarfs. For Albus 5, we confirmed its nature as an sdB star with a FUSE far-ultraviolet spectrum. For the remaining objects, spectroscopic follow-up observations are required to ascertain their true nature. In any case, because of their relative brightness and SED profiles, the five objects can serve as useful spectro-photometric standards or be the subject of dedicated studies (e.g., pulsations and origin of hot subdwarfs, metallic abundances and atmospheric parameters in white dwarfs).
Acknowledgments
This work was partially funded by the Spanish Ministerio de Ciencia e Innovación under the Consolider-Ingenio 2010 Program grant CSD2006-00070 First Science with the Gran Telescopio Canarias. This research has made use of VOSA and VOSED, developed by the Spanish Virtual Observatory through grants AyA2008-02156 and RI031675, and of Aladin and SIMBAD developed at the Centre de Données astronomiques de Strasbourg, France. Financial support was provided by the Universidad Complutense de Madrid, the Comunidad Autónoma de Madrid, and the Spanish Ministerio de Ciencia e Innovación under grants AyA2008-00695, AyA2008-06423-C03-03, SP2009/ESP-1496.
References
- Argelander, F. 1903, Bonner Durchmusterung des nordlichen Himmels (Bonn: Marcus and Weber’s Verlag) [Google Scholar]
- Baschek, B., & Norris, J. 1970, ApJS, 19, 327 [NASA ADS] [CrossRef] [Google Scholar]
- Baschek, B., & Sargent, A. I. 1976, A&A, 53, 47 [NASA ADS] [Google Scholar]
- Berger, J., & Fringant, A. 1977, A&AS, 28, 123 [Google Scholar]
- Berger, J., & Fringant, A. 1978, A&A, 64, L9 [NASA ADS] [Google Scholar]
- Bonifacio, P., Castelli, F., & Hack, M. 1995, A&AS, 110, 441 [Google Scholar]
- Bonnarel, F., Fernique, P., Bienaymé, O., et al. 2000, A&AS, 143, 33 [NASA ADS] [CrossRef] [EDP Sciences] [Google Scholar]
- Brown, A. G. A., & Verschueren, W. 1997, A&A, 319, 811 [NASA ADS] [Google Scholar]
- Caballero, J. A. 2009, Multi-wavelength Astronomy and Virtual Observatory, Proceedings of the EURO-VO Workshop, held at the European Space Astronomy Centre of ESA, Villafranca del Castillo, Spain, 1–3 December, 2008, ed. D. Baines, & P. Osuna, published by the European Space Agency, 3 [Google Scholar]
- Caballero, J. A., & Solano, E. 2007, ApJ, 665, L151 [NASA ADS] [CrossRef] [Google Scholar]
- Cannon, A. J., & Pickering, E. 1925, The Henry Draper (HD) Catalogue, HD extension, ed. A. J. Cannon, & E. Pickering, 100 [Google Scholar]
- Carnochan, D. J., & Wilson, R. 1983, MNRAS, 202, 317 [NASA ADS] [Google Scholar]
- Castelli, F., Gratton, R. G., & Kurucz, R. L. 1997, A&A, 318, 841 [NASA ADS] [Google Scholar]
- Chayer, P., Oliveira, C., Dupuis, J., Moos, H. W., & Welsh, B. Y. 2006, in Astrophysics in the Far Ultraviolet: Five Years of Discovery with FUSE, ed. G. Sonneborn, H. W. Moos, & B.-G. Andersson, ASP Conf. Ser., 348, 209 [Google Scholar]
- Conlon, E. S., Dufton, P. L., Keenan, F. P., & Leonard, P. J. T. 1990, A&A, 236, 357 [NASA ADS] [Google Scholar]
- Crook, A. C., Huchra, J. P., Martimbeau, N., et al. 2007, ApJ, 655, 790 [NASA ADS] [CrossRef] [Google Scholar]
- Drilling, J. S., & Bergeron, L. E. 1995, PASP, 107, 846 [NASA ADS] [CrossRef] [Google Scholar]
- Edelmann, H., Heber, U., & Napiwotzki, R. 2001, AN, 322, 401 [Google Scholar]
- Epchtein, N., de Batz, B., Capoani, L., et al. 1997, The Messenger, 87, 27 [NASA ADS] [Google Scholar]
- Feige, J. 1958, ApJ, 128, 267 [NASA ADS] [CrossRef] [Google Scholar]
- Giclas, H. L., Burnham, R., & Thomas, N. G. 1965, Lowell Observatory Bulletin, 6, 155 [Google Scholar]
- Giclas, H. L., Burnham, R., & Thomas, N. G. 1967, Lowell Observatory Bulletin, 7, 49 [NASA ADS] [Google Scholar]
- Gould, N. L., Herbig, G. H., & Morgan, W. W. 1957, PASP, 69, 242 [NASA ADS] [CrossRef] [Google Scholar]
- Greenstein, J. L. 1966, ApJ, 144, 496 [NASA ADS] [CrossRef] [Google Scholar]
- Greenstein, J. L. 1969, ApJ, 158, 281 [NASA ADS] [CrossRef] [Google Scholar]
- Greenstein, J. L., & Sargent, A. I. 1974, ApJS, 28, 157 [NASA ADS] [CrossRef] [Google Scholar]
- Hambly, N. C., MacGillivray, H. T., Read, M. A., et al. 2001, MNRAS, 326, 1279 [NASA ADS] [CrossRef] [Google Scholar]
- Haro, G., & Luyten, W. J. 1962, Boletin de los Observatorios Tonantzintla y Tacubaya, 3, 37 [Google Scholar]
- Høg, E., Fabricius, C., Makarov, V. V., et al. 2000, A&A, 355, L27 [NASA ADS] [Google Scholar]
- Holberg, J. B., Barstow, M. A., Buckley, D. A. H., et al. 1993, ApJ, 416, 806 [NASA ADS] [CrossRef] [Google Scholar]
- Hoogerwerf, R., de Bruijne, J. H. J., & de Zeeuw, P. T. 2001, A&A, 365, 49 [NASA ADS] [CrossRef] [EDP Sciences] [Google Scholar]
- Humason, M. L., & Zwicky, F. 1947, ApJ, 105, 85 [NASA ADS] [CrossRef] [Google Scholar]
- Kapteyn, J. C. 1914, ApJ, 40, 43 [NASA ADS] [CrossRef] [Google Scholar]
- Kilkenny, D., Heber, U., & Drilling, J. S. 1988, South African Astronomical Observatory Circular, 12, 1 [Google Scholar]
- Lépine, S., & Shara, M. M. 2005, AJ, 129, 1483 [NASA ADS] [CrossRef] [Google Scholar]
- Luyten, W. J. 1949, ApJ, 109, 528 [NASA ADS] [CrossRef] [Google Scholar]
- Luyten, W. J. 1957, in The Observatory, Univ. Minnesota, Minneapolis, 1953, 9, 1 [NASA ADS] [Google Scholar]
- Martin, J. C. 2006, AJ, 131, 3047 [NASA ADS] [CrossRef] [Google Scholar]
- McCook, G. P., & Sion, E. M. 1999, ApJS, 121, 1 [NASA ADS] [CrossRef] [Google Scholar]
- Monet, D. G., Levine, S. E., Canzian, B., et al. 2003, AJ, 125, 984 [NASA ADS] [CrossRef] [Google Scholar]
- Ofek, E. O. 2008, PASP, 120, 1128 [NASA ADS] [CrossRef] [Google Scholar]
- Oke, J. B. 1990, AJ, 99, 1621 [NASA ADS] [CrossRef] [Google Scholar]
- Oke, J. B., & Gunn, J. E. 1983, ApJ, 266, 713 [NASA ADS] [CrossRef] [Google Scholar]
- O’Toole, S. J., & Heber, U. 2006, A&A, 452, 579 [NASA ADS] [CrossRef] [EDP Sciences] [Google Scholar]
- Perryman, M. A. C., Lindegren, L., Kovalevsky, J., et al. 1997, A&A, 323, L49 [NASA ADS] [Google Scholar]
- Pickering, E. C., & Cannon, A. J. 1897, ApJ, 6, 349 [NASA ADS] [CrossRef] [Google Scholar]
- Röser, S., Schilbach, E., Schwan, H., et al. 2008, A&A, 488, 401 [NASA ADS] [CrossRef] [EDP Sciences] [Google Scholar]
- Rucinski, S. M. 2009, MNRAS, 395, 2299 [NASA ADS] [CrossRef] [Google Scholar]
- Schonfeld, E. 1886, in Bonner Durchmusterung des nordlichen Himmels (Bonn: Marcus and Weber’s Verlag) [Google Scholar]
- Schwartz, R. D. 1972, PASP, 84, 28 [NASA ADS] [CrossRef] [Google Scholar]
- Sion, E. M., Holberg, J. B., Oswalt, T. D., McCook, G. P., & Wasatonic, R. 2009, AJ, 138, 1681 [NASA ADS] [CrossRef] [Google Scholar]
- Skrutskie, M. F., Cutri, R. M., Stiening, R., et al. 2006, AJ, 131, 1163 [NASA ADS] [CrossRef] [Google Scholar]
- Stephenson, C. B., Sanduleak, N., & Hoffleit, D. 1968, PASP, 80, 92 [NASA ADS] [CrossRef] [Google Scholar]
- Stone, R. P. S. 1977, ApJ, 218, 767 [NASA ADS] [CrossRef] [Google Scholar]
- Thackeray, A. D. 1961, Monthly Notes of the Astronomical Society of South Africa, 20, 40 [NASA ADS] [Google Scholar]
- Thome, J. M. 1894, Cordoba Durchmusterung. Brightness and position of every fixed star down to the 10. magnitude comprised in the belt of the heavens between 32 and 90 degrees of southern declination −32 deg. to −42 deg., ed. J. M. Thome, 17 [Google Scholar]
- Urban, S. E., Corbin, T. E., Wycoff, G. L., et al. 1998, AJ, 115, 1212 [NASA ADS] [CrossRef] [Google Scholar]
- van Albada, T. S. 1961, Bull. Astron. Inst. Netherlands, 15, 301 [NASA ADS] [Google Scholar]
- van Leeuwen, F. 2007, A&A, 474, 653 [NASA ADS] [CrossRef] [EDP Sciences] [Google Scholar]
- Voûte, J. 1918, ApJ, 48, 144 [NASA ADS] [CrossRef] [Google Scholar]
- Zuckerman, B., Song, I., & Webb, R. A. 2001, ApJ, 559, 388 [NASA ADS] [CrossRef] [Google Scholar]
All Tables
All Figures
|
Fig. 1 Histograms of the angular separation in right ascension (upper panel) and declination (lower panel) between the Tycho-2 and the closest 2MASS counterpart, after correcting the 2MASS coordinates for Tycho-2 proper motion. The vertical dashed lines indicate the maximum separation allowed for a reliable cross-match, 3σρα = 0.69 arcsec in right ascension, and 3σρδ = 0.78 arcsec in declination. |
| In the text | |
|
Fig. 2 Reduced proper motion diagram (HVT versus VT − KS). Selected objects are bluewards of the dashed vertical line at VT − Ks = −0.5 mag. Previously unreported blue high proper motion objects are depicted with (red) filled circles. Already known blue high proper motion objects are shown with (blue) open symbols: hot subdwarfs with squares, white dwarfs with diamonds, young main-sequence stars with up-triangles, and other stars with down-triangles. Objects redder than VT − Ks = −0.5 mag are marked with (black) small dots. |
| In the text | |
|
Fig. 3 Verification of the high proper motion of Albus 4 (TYC 6017–419–1), a representative blue high proper motion object, in a Ks-band 2MASS image. The epochs of observation in the AC2000.2 (blue diamond), SuperCOSMOS (red square), and 2MASS (yellow circles) are shown in parenthesis. The DENIS epoch almost coincides with the 2MASS one. |
| In the text | |
|
Fig. 4 Theoretical fitting of the Albus SEDs. Solid lines represent the Kurucz models that best fits the observational data. Filled (blue) and open (red) circles indicate the photometric data used for the fit and the synthetic GRIZ photometry data used for control, respectively. The thin (green) line in the second panel depicts the ultraviolet FUSE spectra of Albus 5. |
| In the text | |
|
Fig. 5 FUSE spectra of the sdB star HD 205805 (upper panel) and Albus 5 (lower panel). The strongest observed lines (e.g. of the Lyman series) and multiplets (e.g. C iii) have been labelled. |
| In the text | |
Current usage metrics show cumulative count of Article Views (full-text article views including HTML views, PDF and ePub downloads, according to the available data) and Abstracts Views on Vision4Press platform.
Data correspond to usage on the plateform after 2015. The current usage metrics is available 48-96 hours after online publication and is updated daily on week days.
Initial download of the metrics may take a while.