Fig. 9
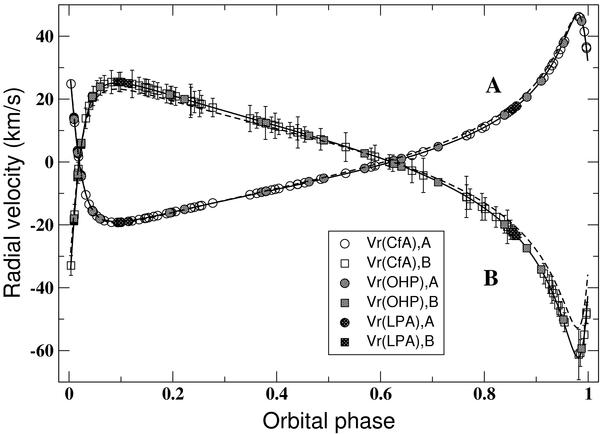
Combined orbital solution (full lines) plotted with component radial velocities(symbols “°” for component A and “□” for component B) derived with FDBinary. Combined orbital solution derived by TSL97 (dashed lines). The different data sets obtained with the Elodie (observatoire de haute-provence, OHP), Hermes (Roque de Los Muchachos Observatory, LPA) and CfA spectrographs are represented by the different shades of grey, see legend.
Current usage metrics show cumulative count of Article Views (full-text article views including HTML views, PDF and ePub downloads, according to the available data) and Abstracts Views on Vision4Press platform.
Data correspond to usage on the plateform after 2015. The current usage metrics is available 48-96 hours after online publication and is updated daily on week days.
Initial download of the metrics may take a while.