Fig. 10
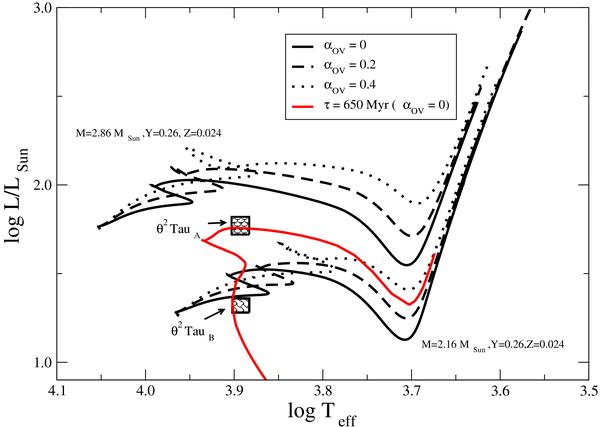
Location of θ2 Tau AB in the Hertzsprung-Russell diagram. The curves represent evolutionary tracks for the masses corresponding to θ2 Tau AB, the metallicity of the Hyades (following LE01) and three levels of overshooting, αOV (different black curves as indicated in the legend) and an isochrone of age of 650 Myr (red curve), all computed using the code Cesam (Morel & Lebreton 2008).
Current usage metrics show cumulative count of Article Views (full-text article views including HTML views, PDF and ePub downloads, according to the available data) and Abstracts Views on Vision4Press platform.
Data correspond to usage on the plateform after 2015. The current usage metrics is available 48-96 hours after online publication and is updated daily on week days.
Initial download of the metrics may take a while.