Fig. 7
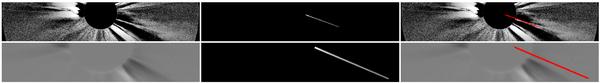
3D geometrical modeling of the ray observations of STA/COR2 (upper panel) and of LASCO/C2 (lower panel). The left column shows TB images for each spacecraft, where a pre-event image was first subtracted. The middle column shows TB images of the ray from our 3D modeling whereas the right column shows overlays of the rectangular slab model wireframe(red) on the corresponding TB images. Times of the observation: 17:52:20 UT for STA/COR2 and 17:50:04 for LASCO/C2.
Current usage metrics show cumulative count of Article Views (full-text article views including HTML views, PDF and ePub downloads, according to the available data) and Abstracts Views on Vision4Press platform.
Data correspond to usage on the plateform after 2015. The current usage metrics is available 48-96 hours after online publication and is updated daily on week days.
Initial download of the metrics may take a while.