Fig. 1
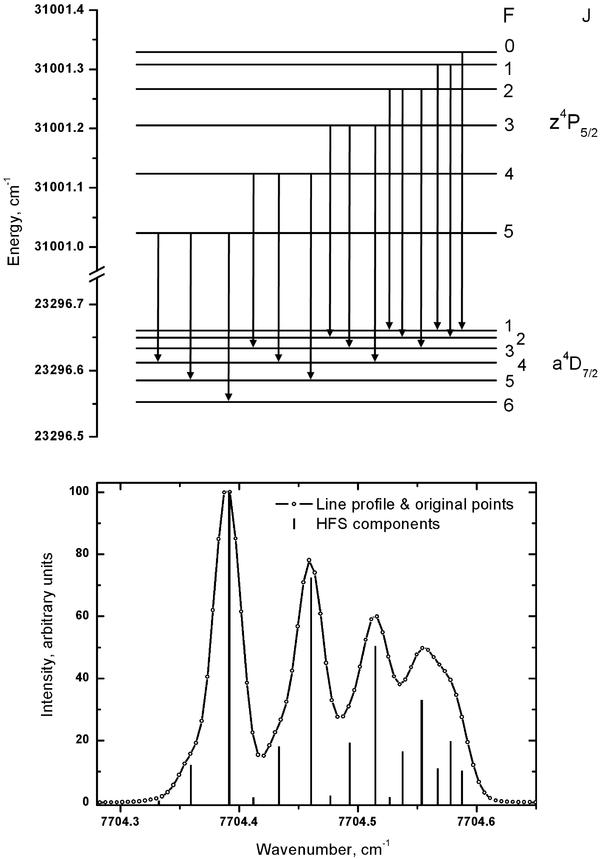
The upper plot shows the hyperfine splitting of the fine structure
levels 3d6(5D)4s
a 4D7/2 − 3d5(6S)4s4p(3P)
 with
allowed hyperfine transitions. The lower plot shows the hyperfine
split profile of the transition observed in the uncalibrated laboratory spectrum at
12 975 Å, together with an indication of the positions and relative line strengths of
the individual HFS transitions. A complete list of the Ritz wavelength and
log (gf) for each HFS transition is available in Table 2.
with
allowed hyperfine transitions. The lower plot shows the hyperfine
split profile of the transition observed in the uncalibrated laboratory spectrum at
12 975 Å, together with an indication of the positions and relative line strengths of
the individual HFS transitions. A complete list of the Ritz wavelength and
log (gf) for each HFS transition is available in Table 2.
Current usage metrics show cumulative count of Article Views (full-text article views including HTML views, PDF and ePub downloads, according to the available data) and Abstracts Views on Vision4Press platform.
Data correspond to usage on the plateform after 2015. The current usage metrics is available 48-96 hours after online publication and is updated daily on week days.
Initial download of the metrics may take a while.