Fig. 4
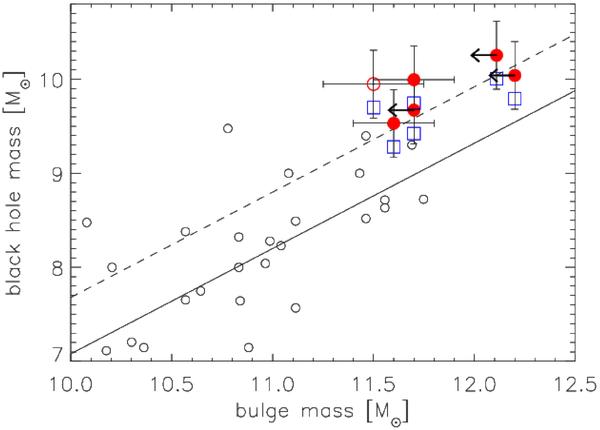
Black-hole masses as estimated in Sect. 4.3 as a function of stellar mass of the host galaxy, taken from Seymour et al. (2007). Red dots mark the HzRG in which we detected HαBLRs, not correcting for inclination, and blue empty squares show the same galaxies with black-hole masses estimated assuming the inclination correction of Jarvis & McLure (2002). The empty circle marks TXS1113-178 for which we used the average HzRG mass of Seymour et al. (2007). Arrows mark galaxies for which Seymour et al. only provide upper limits (see text for details). Empty circles show the nearby galaxies of Häring & Rix (2004), and the black dashed line shows the best linear fit to their sample.
Current usage metrics show cumulative count of Article Views (full-text article views including HTML views, PDF and ePub downloads, according to the available data) and Abstracts Views on Vision4Press platform.
Data correspond to usage on the plateform after 2015. The current usage metrics is available 48-96 hours after online publication and is updated daily on week days.
Initial download of the metrics may take a while.