Fig. 3
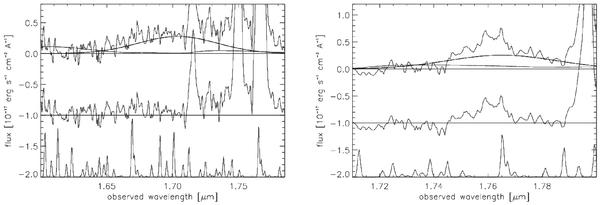
We detected broad Hβ line emission in two of our galaxies, MRC1558-003 and MRC2025-218 (upper panels). Thick black lines show a Gaussian line profile with the same redshift and line width, which we measured for Hα, scaled to match the Hβ flux. Thick gray lines show the FeII template from Iwamuro et al. (2002), to illustrate that the contribution of FeII is negligible in both cases. We subtracted the continuum in both spectra. The middle and lower panels show the fit residual spectrum after subtracting Hβ and the position of night sky lines, respectively.
Current usage metrics show cumulative count of Article Views (full-text article views including HTML views, PDF and ePub downloads, according to the available data) and Abstracts Views on Vision4Press platform.
Data correspond to usage on the plateform after 2015. The current usage metrics is available 48-96 hours after online publication and is updated daily on week days.
Initial download of the metrics may take a while.