Fig. 2
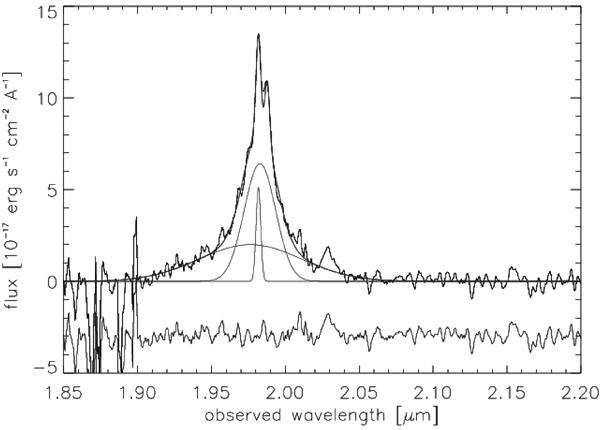
Close-up of the Hα spectral region of MRC0156-003. We show the spectrum with the best fit superimposed (thick black line). Thin black lines show each individual fit component. The lower panel shows the fit residual. The line at λ = 2.03 μm is the [SII]λλ6716, 6731 doublet, where the two components are blended. At wavelengths shortward of 1.9 μm the atmospheric transmission drops to <10%.
Current usage metrics show cumulative count of Article Views (full-text article views including HTML views, PDF and ePub downloads, according to the available data) and Abstracts Views on Vision4Press platform.
Data correspond to usage on the plateform after 2015. The current usage metrics is available 48-96 hours after online publication and is updated daily on week days.
Initial download of the metrics may take a while.