Free Access
Fig. 5
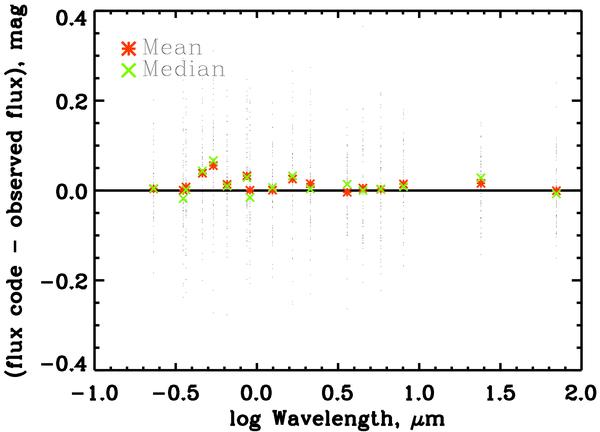
Difference in magnitudes between the flux of the mock galaxies and the flux of the best χ2 model for these objects in each band. Red crosses and green crosses represent the mean and the median value for each wavelength.
Current usage metrics show cumulative count of Article Views (full-text article views including HTML views, PDF and ePub downloads, according to the available data) and Abstracts Views on Vision4Press platform.
Data correspond to usage on the plateform after 2015. The current usage metrics is available 48-96 hours after online publication and is updated daily on week days.
Initial download of the metrics may take a while.