Free Access
Fig. 2
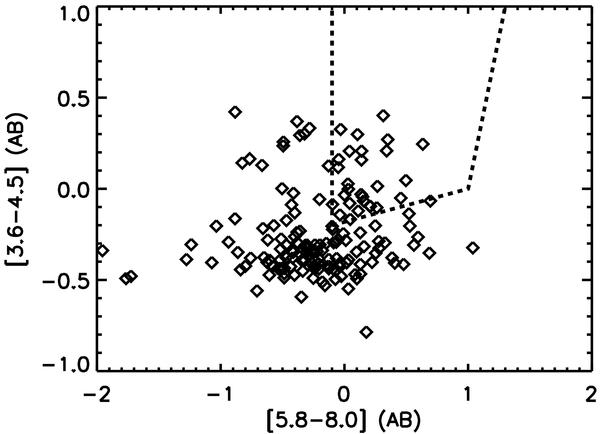
Colour–colour diagram recommended by Stern et al. (2005) to identify AGN candidates. We compare the colour [3.6 μm − 4.5 μm] versus [5.8 μm − 8.0 μm] in AB magnitudes for our LIRGs; the area defined by the dashed lines represents the region of the colour − colour diagram populated by AGN.
Current usage metrics show cumulative count of Article Views (full-text article views including HTML views, PDF and ePub downloads, according to the available data) and Abstracts Views on Vision4Press platform.
Data correspond to usage on the plateform after 2015. The current usage metrics is available 48-96 hours after online publication and is updated daily on week days.
Initial download of the metrics may take a while.