Fig. 13
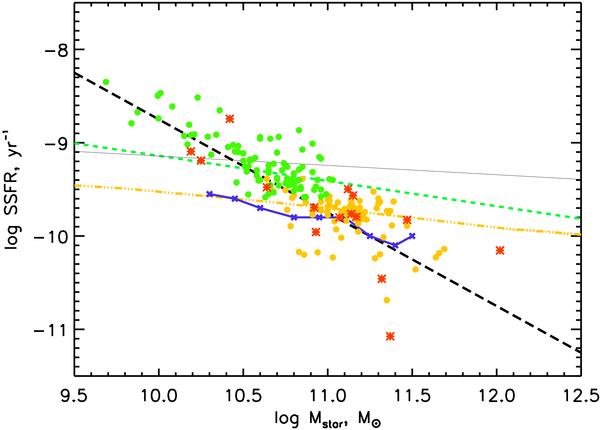
The SSFR − M ⋆ relation for the total sample. Green dots and yellow dots represent objects for which fySP are larger or lower than 10%, respectively. AGN contaminated objects are represented by red stars. The black dashed line shows the detection limit. We overplot analytical models of Buat et al. (2008) (dash-dotted yellow line) at z = 0.7 and Noeske et al. (2007a) (connected blue crosses) at z ~ 0.7, and observations of Elbaz et al. (2007) (solid black line, z = 1) and Santini et al. (2009) at z ~ 0.7 (dashed green line).
Current usage metrics show cumulative count of Article Views (full-text article views including HTML views, PDF and ePub downloads, according to the available data) and Abstracts Views on Vision4Press platform.
Data correspond to usage on the plateform after 2015. The current usage metrics is available 48-96 hours after online publication and is updated daily on week days.
Initial download of the metrics may take a while.