Fig. 12
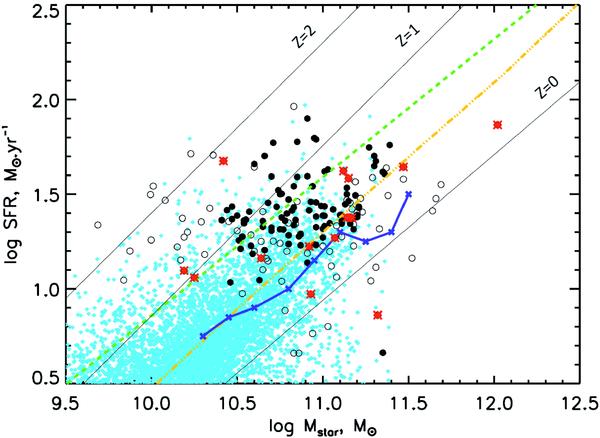
The relation SFR − M ⋆ for the total sample. Filled circles (empty circles) illustrate galaxies for which the age of the young stellar population is found to be greater (lower than or equal to) than 0.3 Gyr by CIGALE. AGNs are represented by red stars. We overplot the semi-analytical Millennium simulations (cyan diamonds), analytical models of Buat et al. (2008) (dash-dotted yellow line) at z = 0.7 and Noeske et al. (2007a) (connected blue crosses) at z ~ 0.7 with observations of Elbaz et al. (2007) (solid black line, z = 0 and 1), Daddi et al. (2007) (solid black line z = 2), and Santini et al. (2009) at z ~ 0.7 (dashed green line).
Current usage metrics show cumulative count of Article Views (full-text article views including HTML views, PDF and ePub downloads, according to the available data) and Abstracts Views on Vision4Press platform.
Data correspond to usage on the plateform after 2015. The current usage metrics is available 48-96 hours after online publication and is updated daily on week days.
Initial download of the metrics may take a while.