Fig. 11
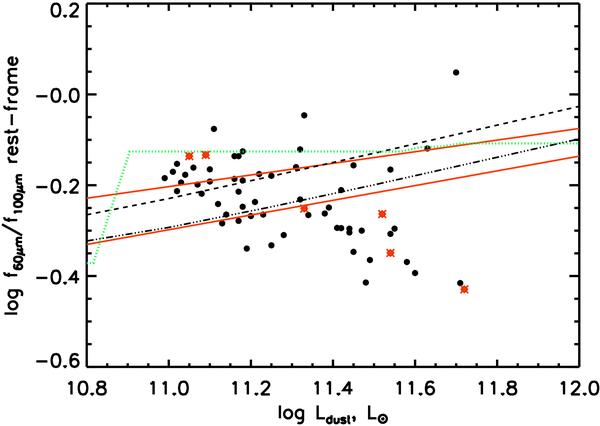
Comparaison of the relation log 10(f60 μm/f100 μm) − log 10Ldust given by IR SEDs of DH02 after the fit to the data, with the values given by local relations and models. Upper and lower solid red lines represent local relations of Chapman et al. (2003) and Marcillac et al. (2006), respectively. We overplot models of CE01 (green dotted line), Chapin et al. (2009a) (dashed black line), and Valiante et al. (2009) (dash-dotted black line). AGN detections are shown as red stars.
Current usage metrics show cumulative count of Article Views (full-text article views including HTML views, PDF and ePub downloads, according to the available data) and Abstracts Views on Vision4Press platform.
Data correspond to usage on the plateform after 2015. The current usage metrics is available 48-96 hours after online publication and is updated daily on week days.
Initial download of the metrics may take a while.