Fig. 10
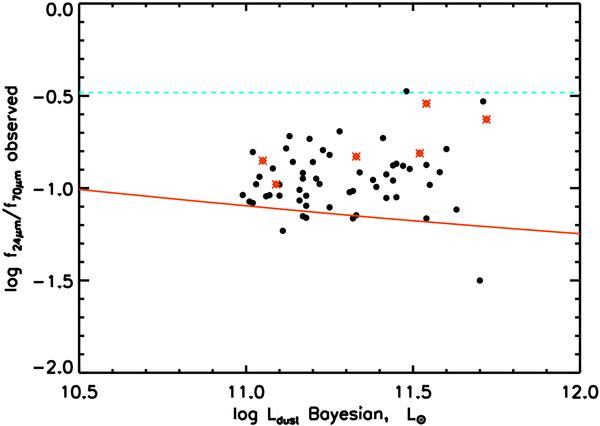
This figure illustrates the ratio between the observed fluxes at 24 μm and 70 μm as a function of the Ldust estimated by the code. The solid red line corresponds to the results given by the DH02 templates at z = 0.7. The dashed cyan line is given by Siebenmorgen et al. (2004b) for typical AGN contaminated object. AGNs described in Sect. 4.2 are shown as red stars.
Current usage metrics show cumulative count of Article Views (full-text article views including HTML views, PDF and ePub downloads, according to the available data) and Abstracts Views on Vision4Press platform.
Data correspond to usage on the plateform after 2015. The current usage metrics is available 48-96 hours after online publication and is updated daily on week days.
Initial download of the metrics may take a while.