Free Access
Fig. 8
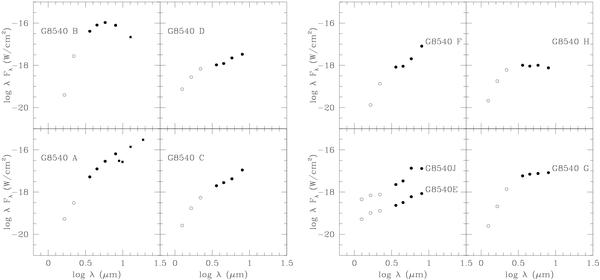
Spectral energy distributions of sources A, B, C, D, E, F, G, H and J in G8540-0.00. Open and filled circles represent the NICS near-infrared and IRAC data, while the filled squares are the CID mid-IR flux densities. For clarity, the SED of source J has been scaled up by a factor of five.
This figure is made of several images, please see below:
Current usage metrics show cumulative count of Article Views (full-text article views including HTML views, PDF and ePub downloads, according to the available data) and Abstracts Views on Vision4Press platform.
Data correspond to usage on the plateform after 2015. The current usage metrics is available 48-96 hours after online publication and is updated daily on week days.
Initial download of the metrics may take a while.