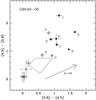
Fig. 7
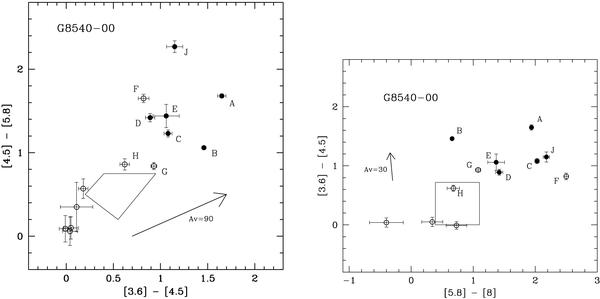
IRAC colour–colour diagrams of the region centred on G8540-00. Left panel: [4.5]–[5.8] vs. [3.6]–[4.5] colours. Right panel: [3.6]–[4.5] vs. [5.8] vs. [8] colours. In both, the boxes mark the location of Class II young stellar objects and the arrows represent the extinction vector (Allen et al. 2004; Guieu et al. 2009). The position of the young sources believed to belong to the cluster are marked with the labels A, B, C, D, E, F, G, H, J, and N. Note that object H is at the edge of the box of class II sources; the others lie in the area occupied by Class I objects.
Current usage metrics show cumulative count of Article Views (full-text article views including HTML views, PDF and ePub downloads, according to the available data) and Abstracts Views on Vision4Press platform.
Data correspond to usage on the plateform after 2015. The current usage metrics is available 48-96 hours after online publication and is updated daily on week days.
Initial download of the metrics may take a while.