Fig. 6
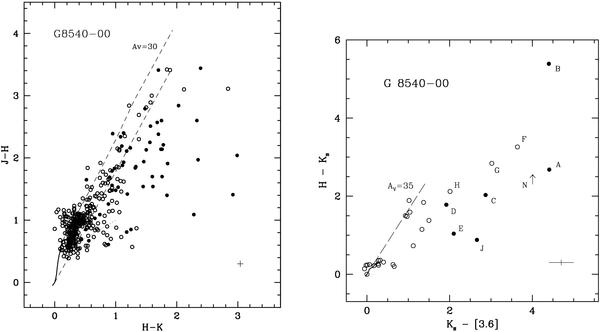
Left panel: J − H versus H − K diagram. The filled circles represent sources located within a radius of 15.5″, the formal limits of the embedded cluster. The open circles represent sources that lie outside this circle. The solid line marks the loci of the main-sequence (MS) stars from Koornneef (1983), while the dashed lines define the reddening band extending from the MS using the reddening vector from Rieke & Lebofsky (1985). Right panel: H − K vs. K − [3.6] diagram for the sources that could also be measured on the IRAC [3.6] images. Symbols are as in the left panel. In both, the reddening vector (broken line) is from Tapia (1981) and the loci of the MS (solid line), from Koornneef (1983); the crosses near the lower right corners show the mean statistical error of the individual measurements.
Current usage metrics show cumulative count of Article Views (full-text article views including HTML views, PDF and ePub downloads, according to the available data) and Abstracts Views on Vision4Press platform.
Data correspond to usage on the plateform after 2015. The current usage metrics is available 48-96 hours after online publication and is updated daily on week days.
Initial download of the metrics may take a while.