Fig. 4
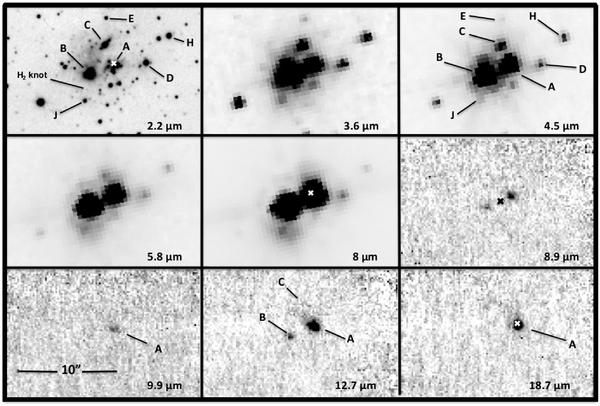
Multiwavelength 2 to 19 μm mosaic of a 20″ × 13″ region centred on G85.40+0.00. Each panel shows at the same scale the emission structure at the corresponding wavelength. The mid-infrared sources with excess emission are labeled A to J. The white crosses on each of the 2.2, 8, and 18.7 μm panels mark the position of the 6.7 GHz methanol maser (Pestalozzi et al. 2005), which coincides with that of the compact radio HII region (Urquhart et al. 2009), the emission peaks of the MSX source at 21.3 μm, and the MIPS (70 μm) and SCUBA (450 and 850 μm, Di Francesco et al. 2008) sources. The black cross on the 8.9 μm panel marks the centroid of the 8.28 μm MSX source.
Current usage metrics show cumulative count of Article Views (full-text article views including HTML views, PDF and ePub downloads, according to the available data) and Abstracts Views on Vision4Press platform.
Data correspond to usage on the plateform after 2015. The current usage metrics is available 48-96 hours after online publication and is updated daily on week days.
Initial download of the metrics may take a while.