Fig. 11
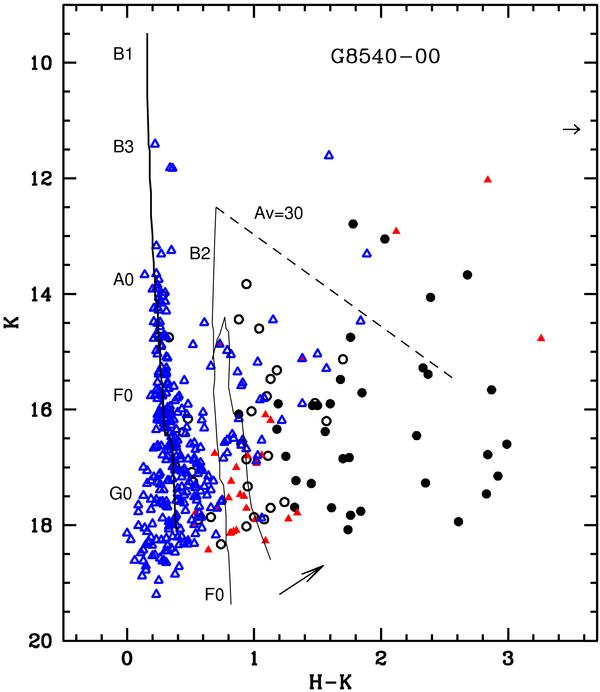
K versus H − K diagram of all sources with HK colours. Filled, black circles represent sources within r < 15.5″ with considerable IR-excesses (at λ > 2 μm). The small horizontal arrow points to the position of source B, with H − K = 5.39. Open black circles have JHK colours of reddened photospheres. Sources outside the cluster area are plotted as triangles; filled symbols (red) show infrared excesses and open (blue) symbols do not. For reference, the thick solid line marks the loci of the main-sequence (MS) stars from Koornneef (1983) for a distance of 2.5 kpc and reddened by E(H − K) = 0.2, corresponding to AV = 4.2. The thin continuous line represents the ZAMS and 105 yr isochrone (Palla & Stahler 1999) for a distance of 8.0 kpc and reddening of E(H − K) = 0.75 (AV = 12.5), parameters that seem to fit the likely cluster members with no infrared excess. The short-dashed line defines the reddening vector from Rieke & Lebofsky (1985) and the long arrow marks the average slope of near-infrared excesses caused by discs around young stellar objects, as determined by Salas et al. (2006). A colour version of this figure is available in the electronic edition.
Current usage metrics show cumulative count of Article Views (full-text article views including HTML views, PDF and ePub downloads, according to the available data) and Abstracts Views on Vision4Press platform.
Data correspond to usage on the plateform after 2015. The current usage metrics is available 48-96 hours after online publication and is updated daily on week days.
Initial download of the metrics may take a while.