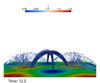
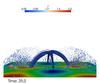
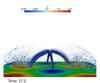
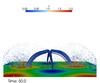
Fig. 5

Lateral view along the positive Y-axis of the distribution of the vector current density inside the simulation volume at different instants of time. The arrows show the vector direction, the color code its amplitude and the size of the arrows the relative strength of the currents. Also shown are the spine and fan field lines, colored by the amplitude of the current, together with the Z component of the magnetic field at the bottom of the simulation box.
Current usage metrics show cumulative count of Article Views (full-text article views including HTML views, PDF and ePub downloads, according to the available data) and Abstracts Views on Vision4Press platform.
Data correspond to usage on the plateform after 2015. The current usage metrics is available 48-96 hours after online publication and is updated daily on week days.
Initial download of the metrics may take a while.