Fig. 2
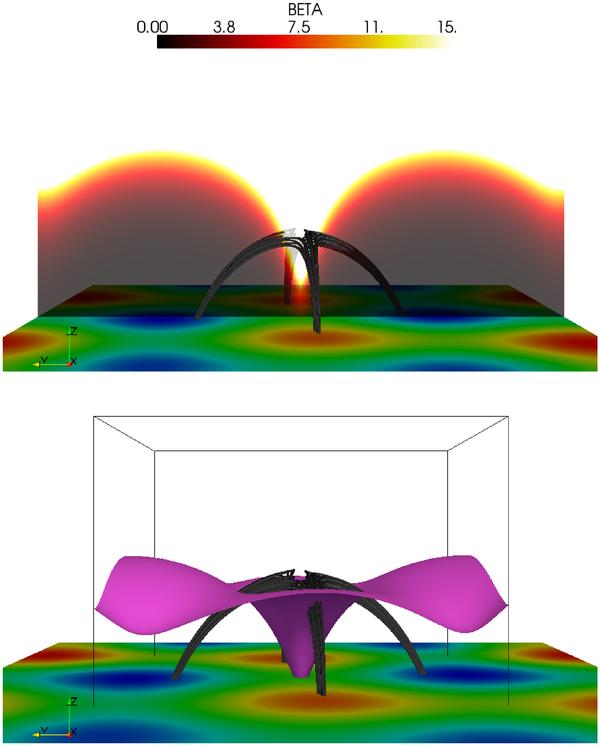
Top panel: color-coded values of plasma β in a plane of x constant located at the center of the simulation box. The values of β are saturated at 15 for a better visualization. Bottom panel: isosurface of β = 1 layer in a subvolume (black box) close to the center of the simulation box (view is along the positive X-axis). Also shown are the fan and spine field lines, together with the Z component of the magnetic field at the bottom boundary of the simulation box.

Current usage metrics show cumulative count of Article Views (full-text article views including HTML views, PDF and ePub downloads, according to the available data) and Abstracts Views on Vision4Press platform.
Data correspond to usage on the plateform after 2015. The current usage metrics is available 48-96 hours after online publication and is updated daily on week days.
Initial download of the metrics may take a while.