Fig. 18
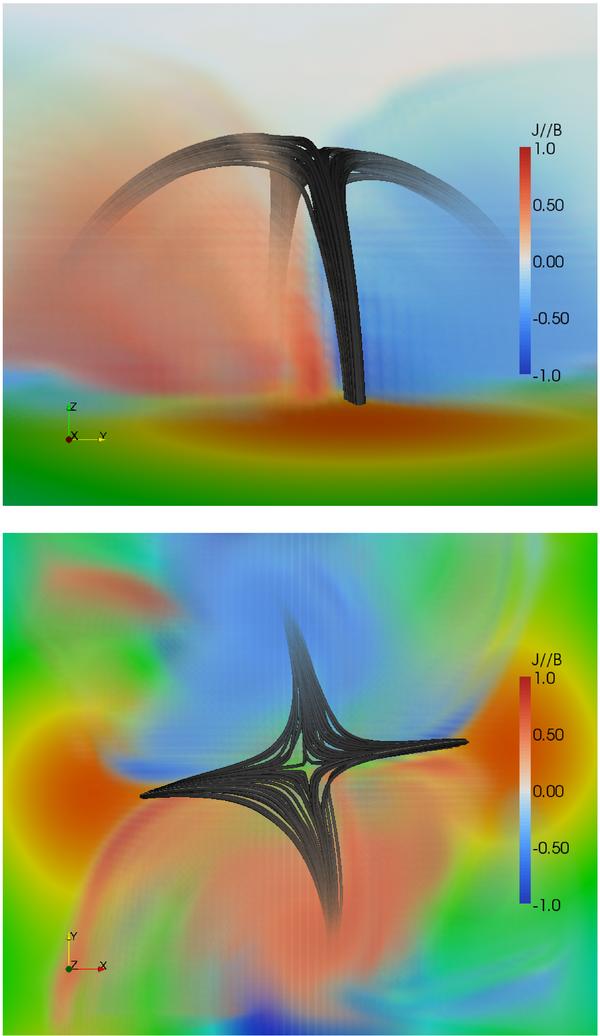
Lateral (top panel) and top (bottom panel) view of the parallel current density distribution in the central region of the simulation box. Red represents parallel currents and blue anti-parallel currents. Also shown are the spine and fan field lines, together with the Z component of the magnetic field at the bottom of the simulation box.
Current usage metrics show cumulative count of Article Views (full-text article views including HTML views, PDF and ePub downloads, according to the available data) and Abstracts Views on Vision4Press platform.
Data correspond to usage on the plateform after 2015. The current usage metrics is available 48-96 hours after online publication and is updated daily on week days.
Initial download of the metrics may take a while.