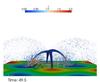
Fig. 17
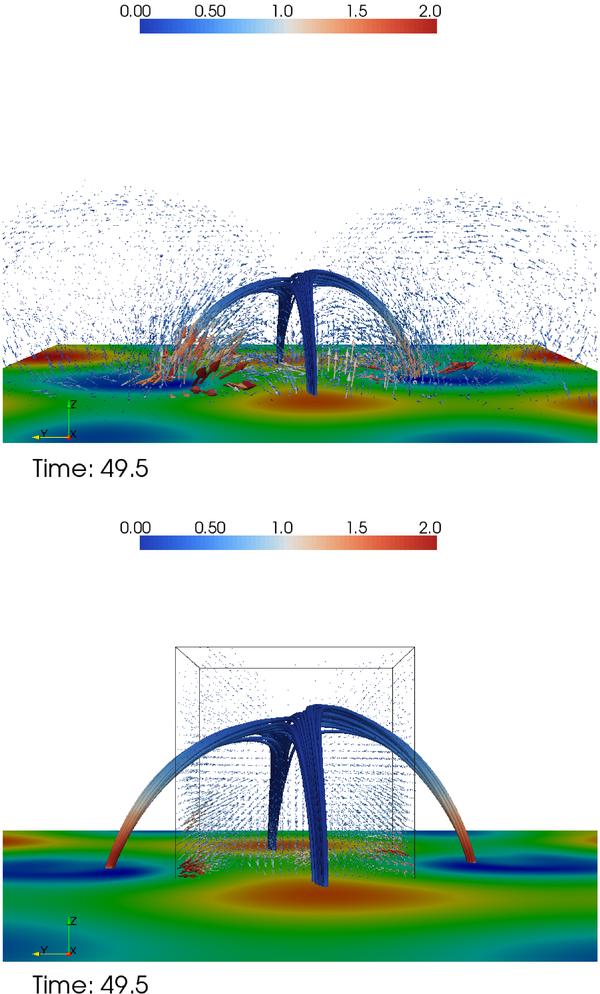
Top – lateral view along the positive X-axis of the distribution of current density vectors inside the simulation box at t = 49.5 τA. The arrows show the current density direction, while the color and size of the arrows represent the current density amplitude. Bottom – close-up of the central region in the simulation box, where the current channel developed in the previous numerical experiments. The view direction is the same as in the top panel.
Current usage metrics show cumulative count of Article Views (full-text article views including HTML views, PDF and ePub downloads, according to the available data) and Abstracts Views on Vision4Press platform.
Data correspond to usage on the plateform after 2015. The current usage metrics is available 48-96 hours after online publication and is updated daily on week days.
Initial download of the metrics may take a while.