Fig. 4
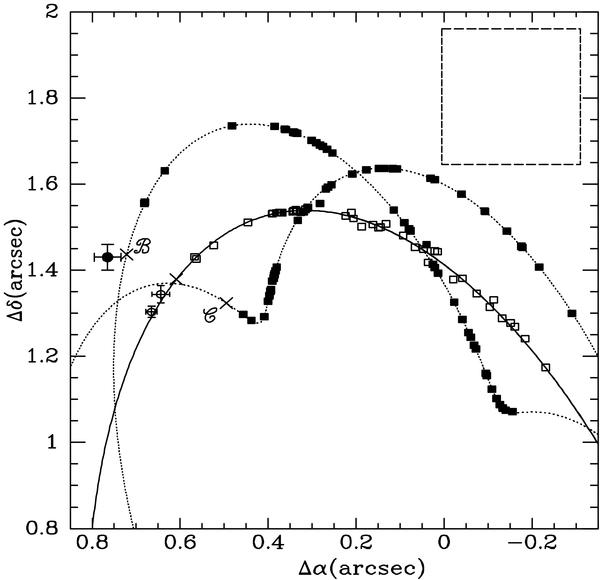
Configuration of LHS 1070 on July 4, 2008. The solid line represents the trajectory of the barycenter of LHS 1070 ℬ+ around LHS 1070
  , which is at the origin. The dotted lines show the trajectories of components ℬ and around the barycenter of LHS 1070 ℬ+, assuming the two components have the same mass. The positions measured by Leinert et al. (2001) and Seifahrt et al. (2008) are shown as open and full squares. Our measurements appear as open circles. The full circle shows our estimated position for the flaring object. The predicted positions of the barycenter of LHS 1070 ℬ+ and of components ℬ and are marked with an “ × ” symbol. The box shown in the upper right corner represents the size of one pixel of our detector.
Current usage metrics show cumulative count of Article Views (full-text article views including HTML views, PDF and ePub downloads, according to the available data) and Abstracts Views on Vision4Press platform.
Data correspond to usage on the plateform after 2015. The current usage metrics is available 48-96 hours after online publication and is updated daily on week days.
Initial download of the metrics may take a while.