Fig. 3
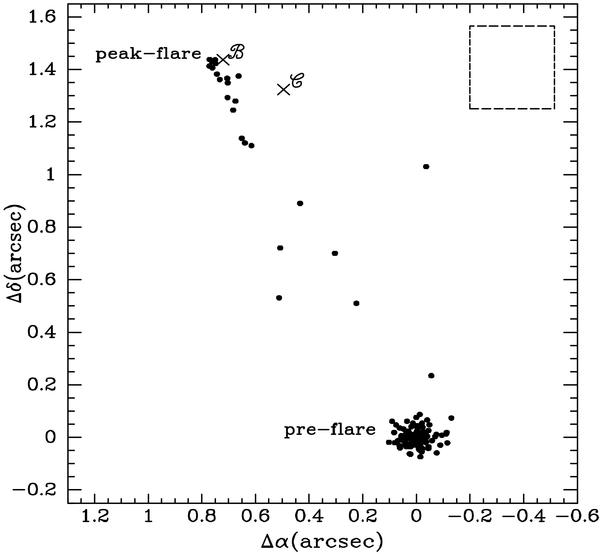
The position of the photocenter of LHS 1070 with respect to a Tycho catalog star. The pre-flare position was obtained using the 101 images before the flare. Its uncertainty can be estimated from the bidimensional distribution of individual positions, and results in a positional accuracy of ~20 mas. The six images around the peak of the event define the position of the photocenter during the flare. The predicted positions of ℬ and  components are marked with an “ × ” symbol considering component
  at the origin. The box shown in the upper right corner represents the size of one pixel.
Current usage metrics show cumulative count of Article Views (full-text article views including HTML views, PDF and ePub downloads, according to the available data) and Abstracts Views on Vision4Press platform.
Data correspond to usage on the plateform after 2015. The current usage metrics is available 48-96 hours after online publication and is updated daily on week days.
Initial download of the metrics may take a while.