Fig. 4
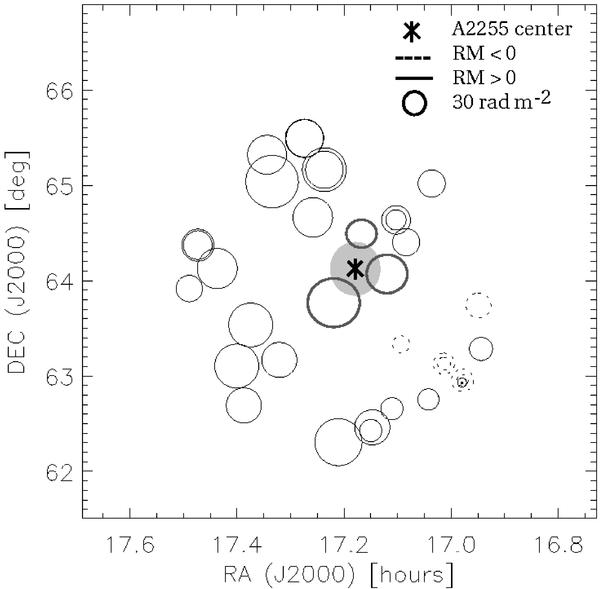
The RM of the 30 sources observed within 2° from the center of A2255. Each circle is centered on the location of a source and its area is proportional to the RM value. In the legend, a scale factor is also shown. The gray circle indicates the X-ray boundaries of A2255 as derived from the ROSAT PSPC observation of the cluster in the 0.5–2.0 keV band (Miller & Owen 2003).
Current usage metrics show cumulative count of Article Views (full-text article views including HTML views, PDF and ePub downloads, according to the available data) and Abstracts Views on Vision4Press platform.
Data correspond to usage on the plateform after 2015. The current usage metrics is available 48-96 hours after online publication and is updated daily on week days.
Initial download of the metrics may take a while.