Fig. 2
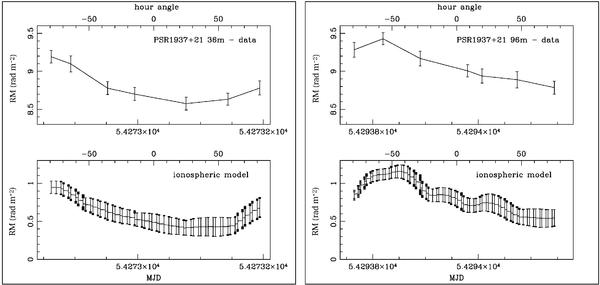
Comparison between the data and the model predictions for the RM variations of PSR1937+21 for the nights when the WSRT was observing in the 36 m (left panel) and 96 m (right panel) configurations. Along the horizontal axes, the time of the observation is expressed in modified Julian days (MJD) and hour angle (HA), going from −90° to +90°. Along the vertical axis we plot the rotation measure, which is the sum of the contributions of the pulsar plus the ionosphere for the data, while it is due to the only ionosphere in the model.
Current usage metrics show cumulative count of Article Views (full-text article views including HTML views, PDF and ePub downloads, according to the available data) and Abstracts Views on Vision4Press platform.
Data correspond to usage on the plateform after 2015. The current usage metrics is available 48-96 hours after online publication and is updated daily on week days.
Initial download of the metrics may take a while.