Fig. 13
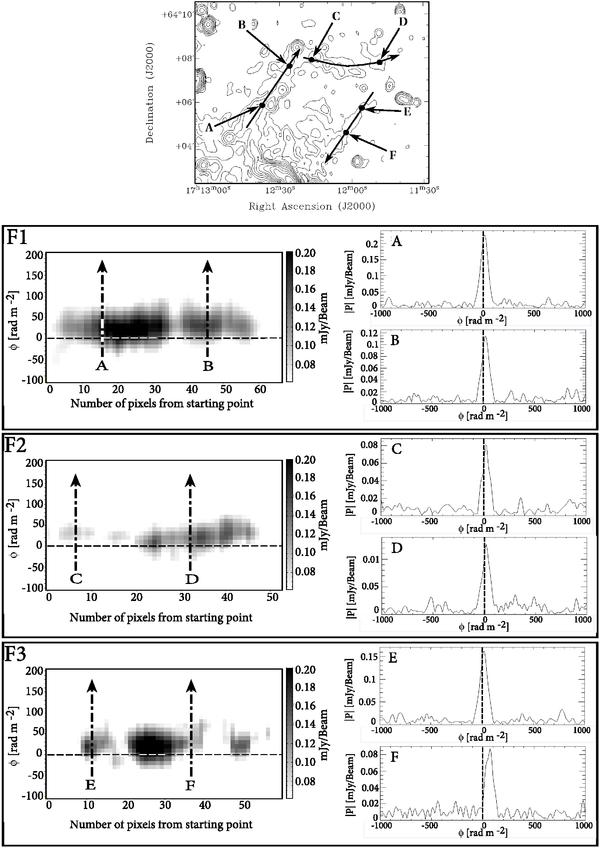
The top panel presents the 25 cm total intensity map of the filaments of A2255. The arrow passing through each filament represents the direction along which the profile of the polarized emission though the RM cube was extracted. These three profiles are reported in panels F1, F2, and F3, together with a couple of examples of Faraday spectra extracted at the locations specified in the total intensity map (A, B, C, D, E, and F). The dotted line is at φ = 0 rad m-2. The total intensity map has a resolution of 14″ × 15″ and the contours are at 0.05, 0.1, 0.2, 0.4, 0.8, 1.6, 3.2, 6.4, 12, 24 mJy beam-1.
Current usage metrics show cumulative count of Article Views (full-text article views including HTML views, PDF and ePub downloads, according to the available data) and Abstracts Views on Vision4Press platform.
Data correspond to usage on the plateform after 2015. The current usage metrics is available 48-96 hours after online publication and is updated daily on week days.
Initial download of the metrics may take a while.