Fig. 11
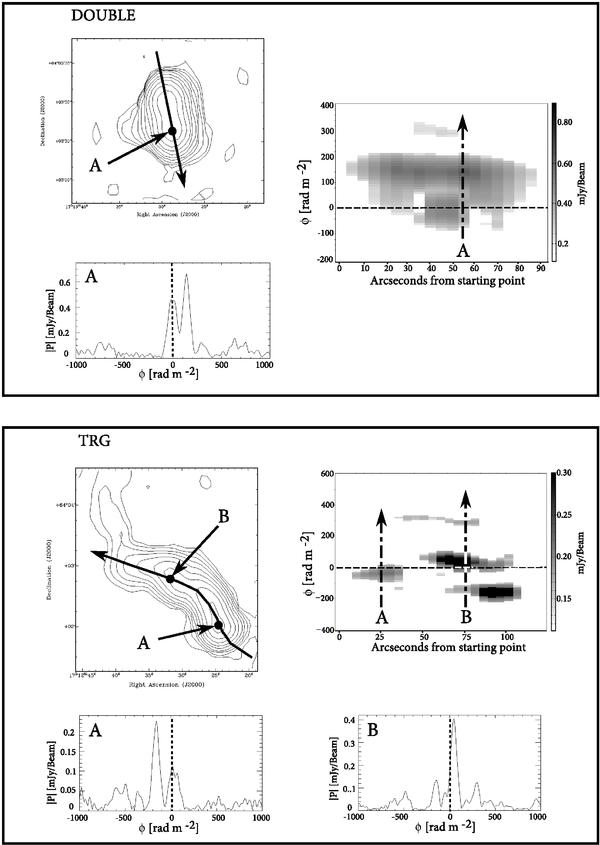
Polarimetric properties of the six radio galaxies belonging to A2255 derived from the high-frequency RM cube. The panels are labeled with the source name and show the 25 cm total intensity contour map plus one or two Faraday spectra extracted at the specified locations (A and B). The arrow passing through each radio galaxy represents the direction along which we extracted the profile of the polarized emission through the RM cube, presented in the right area of each panel. Here, the polarized intensity is in units of mJy beam-1 RMSF-1. The dotted line in the Faraday spectra is at φ = 0 rad m-2. The resolution of the total intensity map is 14″ × 15″ and the contours are at 0.1, 0.2, 0.4, 0.8, 1.6, 3.2, 6.4, 12, 24, 48 mJy beam-1.
Current usage metrics show cumulative count of Article Views (full-text article views including HTML views, PDF and ePub downloads, according to the available data) and Abstracts Views on Vision4Press platform.
Data correspond to usage on the plateform after 2015. The current usage metrics is available 48-96 hours after online publication and is updated daily on week days.
Initial download of the metrics may take a while.