Fig. 1
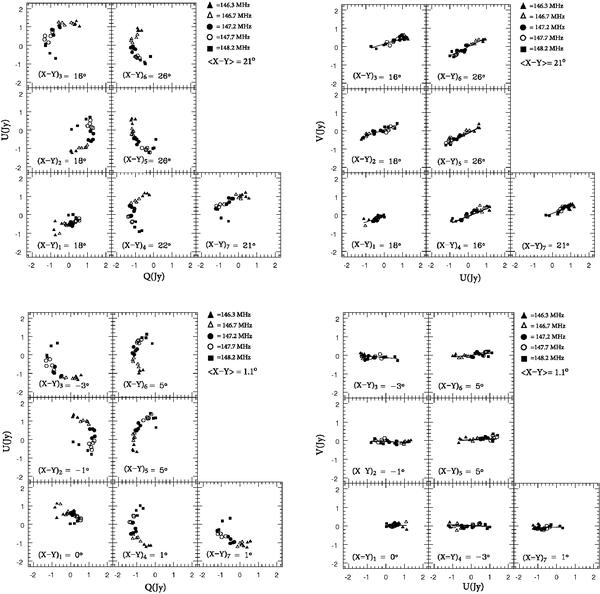
Examples of the QU and UV plots for the 7 short observations of PSR1937 during the 12h session of June 22, 2007 (spacing configuration: RT9–RTA = 36 m) before (top panel) and after (bottom panel) the leakage correction. The plots refer to the frequency band 146–148 MHz. The symbols identify the different sub datasets in which the original dataset has been split (see text). Each point has a value averaged over a group of 10 frequency channels. Since PSR1937+21 has an RM ~ + 8.19 rad m-2, the polarization vector in the QU plane rotates about 80°within this frequency range.
Current usage metrics show cumulative count of Article Views (full-text article views including HTML views, PDF and ePub downloads, according to the available data) and Abstracts Views on Vision4Press platform.
Data correspond to usage on the plateform after 2015. The current usage metrics is available 48-96 hours after online publication and is updated daily on week days.
Initial download of the metrics may take a while.