Fig. 6
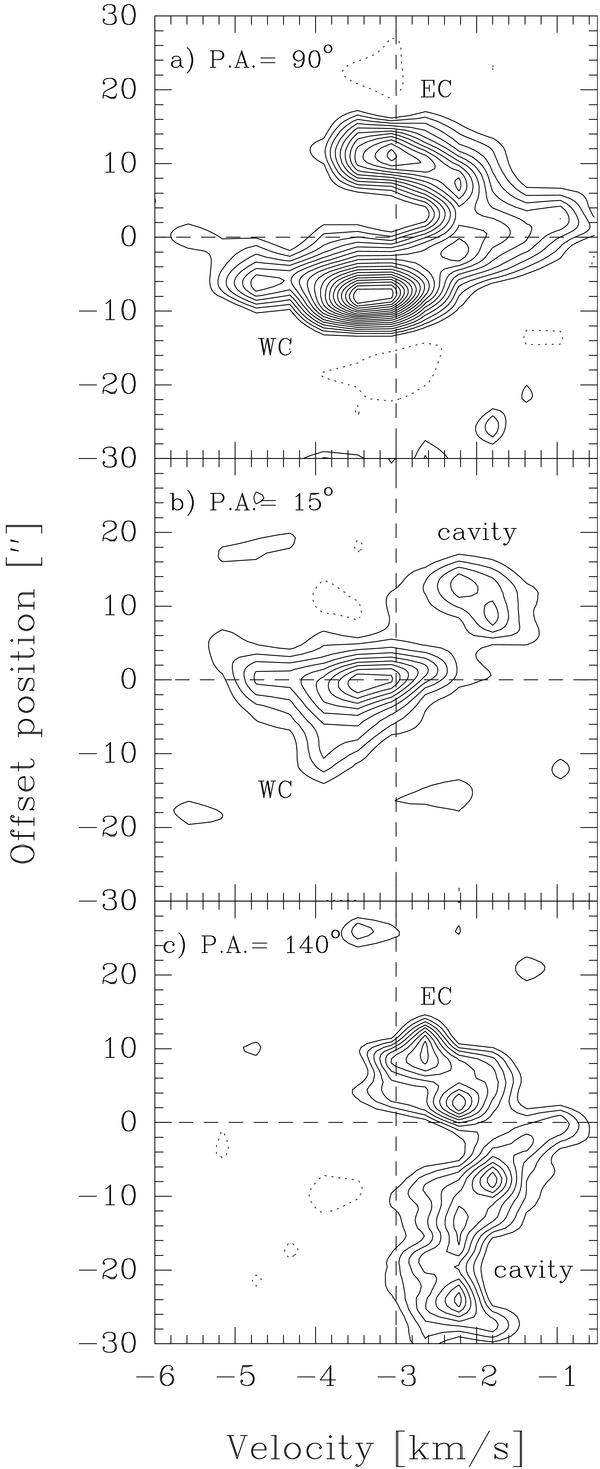
N2H+p − v plot for the F1F = 01 → 12 hyperfine at a) PA = 90° (along the eastern and western cores). Channel maps have been convolved with a beam 6′′ × 2′′ with PA perpendicular to the direction of the cut. Contours start at 10%, increasing in steps of 5% of the peak emission, 0.408 Jy beam-1. The central position corresponds to the 3.2 mm source. Positive offsets are toward the east; b) PA = 15°. Channel maps have been convolved with a beam 2′′ × 2′′. Contours start at 10%, increasing in steps of 10% of the peak emission, 0.601 Jy beam-1. The central position is taken at the peak position of the western core, which is Δ x = −6.5′′, Δ y = −3′′ offset from the phase center. Positive offsets are toward the northeast. c) PA = 140°. Contours start at 20%, and increase in steps of 10% of the peak emission, 0.376 Jy beam-1. Positive offsets are toward the southeast. The central position corresponds to Δ x = 3.9′′, Δ y = −0.59′′ offset from the phase center. In all panels, the vertical dashed line indicates the systemic velocity, vLSR= −3 km s-1.
Current usage metrics show cumulative count of Article Views (full-text article views including HTML views, PDF and ePub downloads, according to the available data) and Abstracts Views on Vision4Press platform.
Data correspond to usage on the plateform after 2015. The current usage metrics is available 48-96 hours after online publication and is updated daily on week days.
Initial download of the metrics may take a while.