Fig. 5
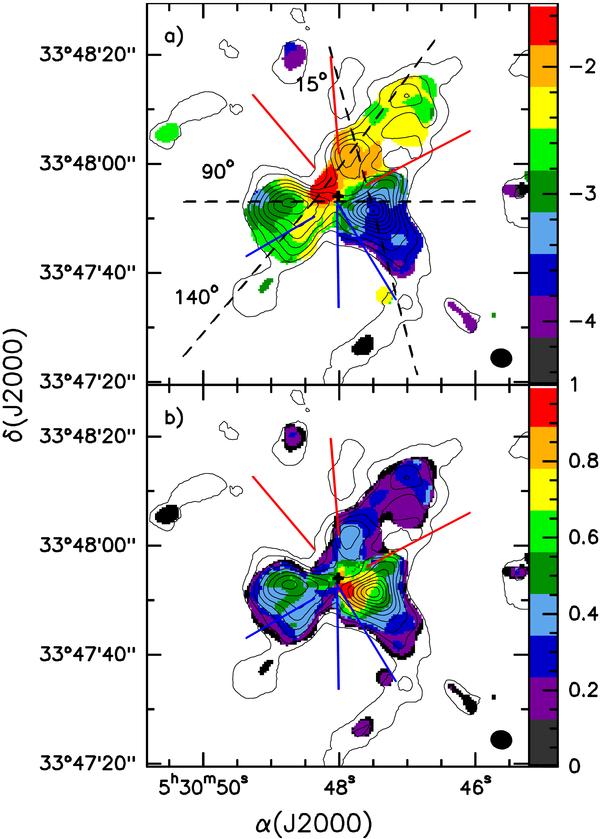
a) First-order moment map (velocity) for the hyperfine F1F = 01 → 12 line of N2H+ (1–0) toward AFGL 5142 (color scale); b) second-order moment map (velocity dispersion) for the hyperfine F1F = 01 → 12 line of N2H+ (1-0) (color scale). In both figures, black contours are the same as in Fig. 4a, showing the N2H+ (1–0) emission, with contours starting at 3%, and increasing in steps of 10% of the peak intensity. Color scales are in km s-1. The synthesized beam is shown in the bottom right corner of the image. The black cross marks the position of the 3.2 mm source reported in this work. Blue and red lines represent the direction of outflows A, B, and C (Zhang et al. 2007), and the black dashed line in the top panel indicates the position-velocity cuts (see Fig. 6). The second-order moment gives the velocity dispersion and must be multiplied by the factor 2 to convert to FWHM.
Current usage metrics show cumulative count of Article Views (full-text article views including HTML views, PDF and ePub downloads, according to the available data) and Abstracts Views on Vision4Press platform.
Data correspond to usage on the plateform after 2015. The current usage metrics is available 48-96 hours after online publication and is updated daily on week days.
Initial download of the metrics may take a while.