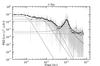
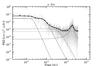
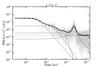
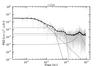
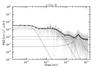
Fig. 2

VPSDs and fits for the 5 stars of our samples. The grey dots corresponds to the binned spectrum using a boxcar algorithm with a changing width according to the frequency. The global fit including granulation phenomena, oscillation modes, photon noise and instrumental noise (black line) is obtained on the binned spectrum. Each contribution to the fit is shown. We can see the 3 types of granulation fitted in light grey lines (supergranulation, mesogranulation and granulation from left to right respectively). The Lorentzian fit to p-modes corresponds to the dashed line and the constant, fitting the photon and instrumental noises, can be see in dotted line.
Current usage metrics show cumulative count of Article Views (full-text article views including HTML views, PDF and ePub downloads, according to the available data) and Abstracts Views on Vision4Press platform.
Data correspond to usage on the plateform after 2015. The current usage metrics is available 48-96 hours after online publication and is updated daily on week days.
Initial download of the metrics may take a while.