Fig. 1
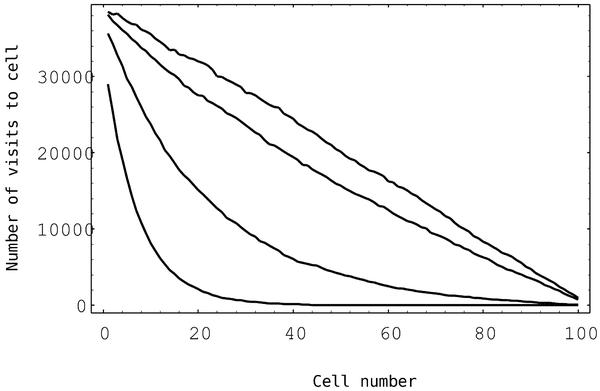
Run of the number of visits of a pseudo particle in a cell (which is proportional to the mean intensity) with cell number (which is proportional to the optical depth starting at the left) in a slab that is illuminated from the left but does not have internal sources. The curves represent ratios of absorption to extinction ε = 0,10-3,10-2,10-1 (from top to bottom). In all cases, N = 105 pseudo particles are used.
Current usage metrics show cumulative count of Article Views (full-text article views including HTML views, PDF and ePub downloads, according to the available data) and Abstracts Views on Vision4Press platform.
Data correspond to usage on the plateform after 2015. The current usage metrics is available 48-96 hours after online publication and is updated daily on week days.
Initial download of the metrics may take a while.