Fig. 2
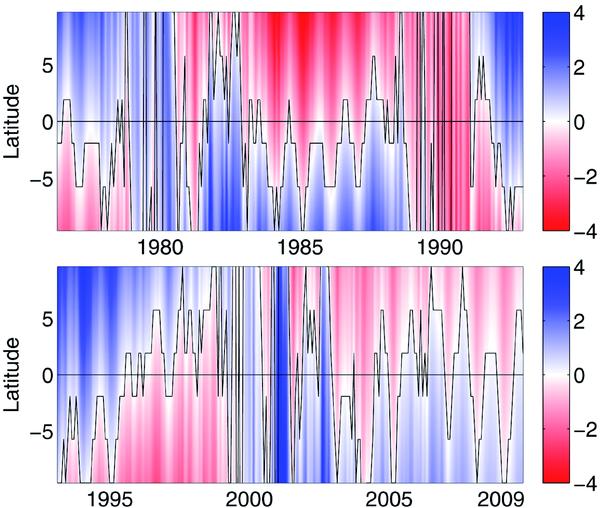
WSO prediction of coronal radial field (in μ Tesla) using PFSS model with source surface distance at 2.5 Rs. Magnetic north (A sector) is depicted in blue and south (T sector) in red. Data were averaged over one solar rotation. Only values around equator are shown. Variable black line denotes the location of field minimum as a proxy of the rotationally averaged HCS. Straight horizontal line denotes the equator.
Current usage metrics show cumulative count of Article Views (full-text article views including HTML views, PDF and ePub downloads, according to the available data) and Abstracts Views on Vision4Press platform.
Data correspond to usage on the plateform after 2015. The current usage metrics is available 48-96 hours after online publication and is updated daily on week days.
Initial download of the metrics may take a while.