Free Access
Fig. 9
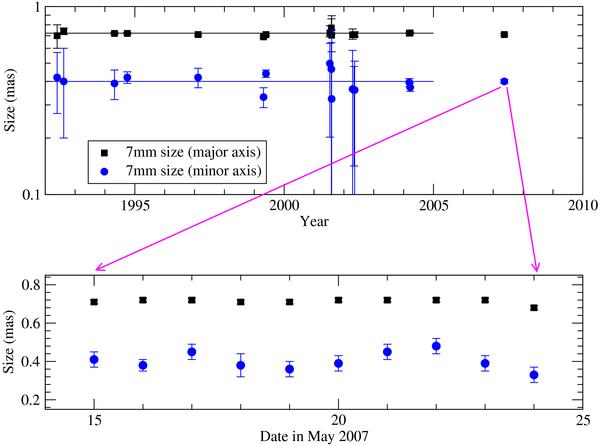
Size of major axis (filled squares) and minor axis (filled circles) plotted versus time at 43 GHz during 1992–2007 (top panel). The solid lines delineate an average of all previous measurements before 2007. The bottom panel shows an enlargement on the data obtained during the 10 days campaign in May 2007.
Current usage metrics show cumulative count of Article Views (full-text article views including HTML views, PDF and ePub downloads, according to the available data) and Abstracts Views on Vision4Press platform.
Data correspond to usage on the plateform after 2015. The current usage metrics is available 48-96 hours after online publication and is updated daily on week days.
Initial download of the metrics may take a while.