Fig. 8
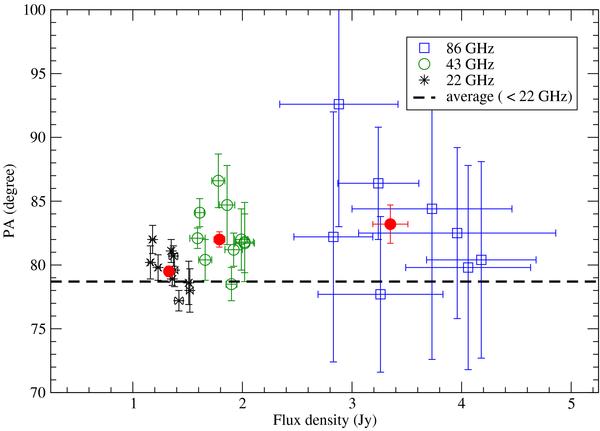
Position angle of the major axis of Sgr A* plotted as a function of flux density for the 10-day VLBI observations at 22 (star), 43 (open circle), and 86 GHz (open square). Also shown are weighted mean average values at each frequency (filled circles). The dashed line represents the mean position angle (78.8 ± 1.7°) at frequencies below 22 GHz taken from literature data. The position angles at 43 and 86 GHz are significantly larger than the position angle at 22 GHz and the lower frequency.
Current usage metrics show cumulative count of Article Views (full-text article views including HTML views, PDF and ePub downloads, according to the available data) and Abstracts Views on Vision4Press platform.
Data correspond to usage on the plateform after 2015. The current usage metrics is available 48-96 hours after online publication and is updated daily on week days.
Initial download of the metrics may take a while.