Fig. 6
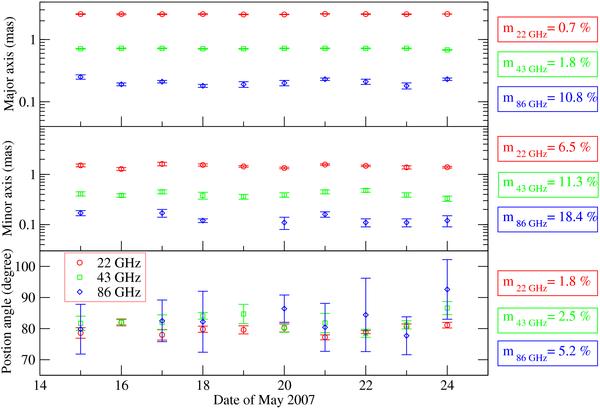
Variability of the source structure of Sgr A* at 22 (circle), 43 (square), and 86 GHz (diamond) between May 15 and 24, 2007. The source structure is well-fitted by a elliptical Gaussian component. Shown as a function of observing day are: the major axis (top panel), the minor axis (middle panel), and the position angle of the major axis (bottom panel). The corresponding variability indices m are given in boxes on the right side. On May 16 and 19 of May 2007, the data at 86 GHz could only be fitted by a circular Gaussian, therefore no minor axis and position angle are given for these two dates.
Current usage metrics show cumulative count of Article Views (full-text article views including HTML views, PDF and ePub downloads, according to the available data) and Abstracts Views on Vision4Press platform.
Data correspond to usage on the plateform after 2015. The current usage metrics is available 48-96 hours after online publication and is updated daily on week days.
Initial download of the metrics may take a while.