Fig. 4
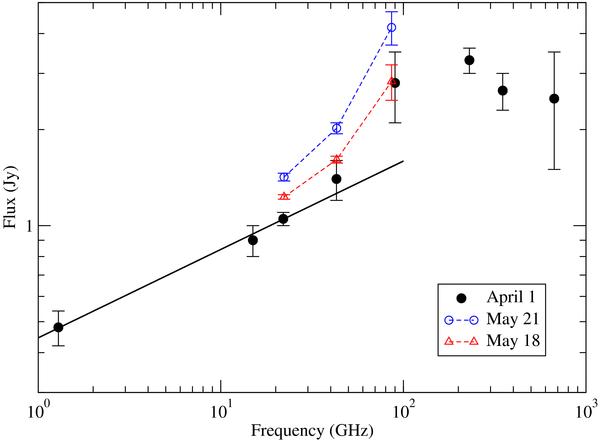
Spectrum of Sgr *A. Filled circles denote a quasi-simultaneous spectrum obtained around April 1, 2007 during a multiwavelength campaign (Yusef-Zadeh et al. 2009). The error bars on the data points indicate the variability of Sgr A*. The solid black line indicates a power law fitted to the radio data up to 43 GHz. Above 43 GHz, a flux density excess over this line is apparent. Open symbols connected by dashed lines indicate the new and quasi-simultaneous flux density measurements of May 18 and 21, 2007, from which high frequency spectral indices were derived, respectively. Note a spectral turnover between 100−230 GHz.
Current usage metrics show cumulative count of Article Views (full-text article views including HTML views, PDF and ePub downloads, according to the available data) and Abstracts Views on Vision4Press platform.
Data correspond to usage on the plateform after 2015. The current usage metrics is available 48-96 hours after online publication and is updated daily on week days.
Initial download of the metrics may take a while.