Fig. 3
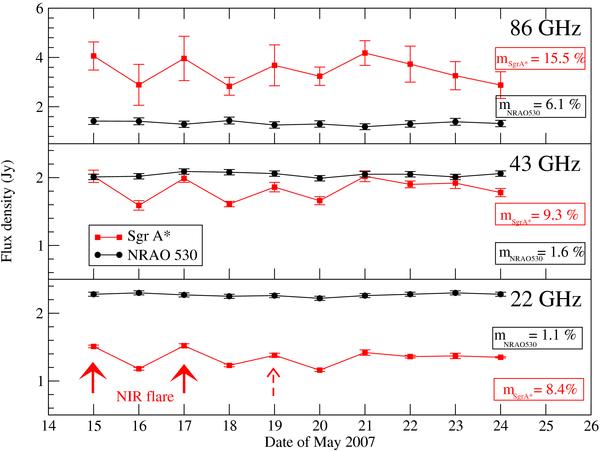
Plot of flux density versus time for Sgr A* and nearby quasar NRAO 530 at 22, 43, and 86 GHz. Two filled arrows indicate times of NIR flares detected on May 15 (Eckart et al. 2008a) and 17. There is another possible mm flare (dashed arrow) on May 19 (Kunneriath et al. 2010). In boxes, the variability index m is given for Sgr A* and NRAO 530 at each frequency. The stationarity of the flux densities of NRAO 530 characterize the quality and repeatability of the overall amplitude calibration.
Current usage metrics show cumulative count of Article Views (full-text article views including HTML views, PDF and ePub downloads, according to the available data) and Abstracts Views on Vision4Press platform.
Data correspond to usage on the plateform after 2015. The current usage metrics is available 48-96 hours after online publication and is updated daily on week days.
Initial download of the metrics may take a while.