Free Access
Fig. 14
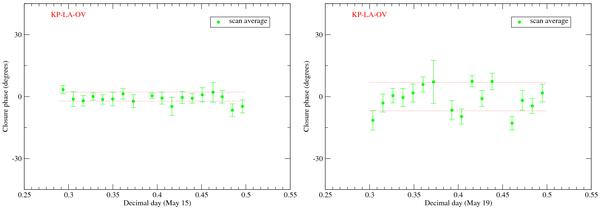
Plot of a typical closure phase as function of time for the KP-LA-OV triangle from the 86 GHz experiment on May 15 (left) and 19 (right), 2007. In each plot, dotted lines indicate a 1σ range for the closure phase averaged over a whole experiment.
This figure is made of several images, please see below:
Current usage metrics show cumulative count of Article Views (full-text article views including HTML views, PDF and ePub downloads, according to the available data) and Abstracts Views on Vision4Press platform.
Data correspond to usage on the plateform after 2015. The current usage metrics is available 48-96 hours after online publication and is updated daily on week days.
Initial download of the metrics may take a while.