Fig. 8
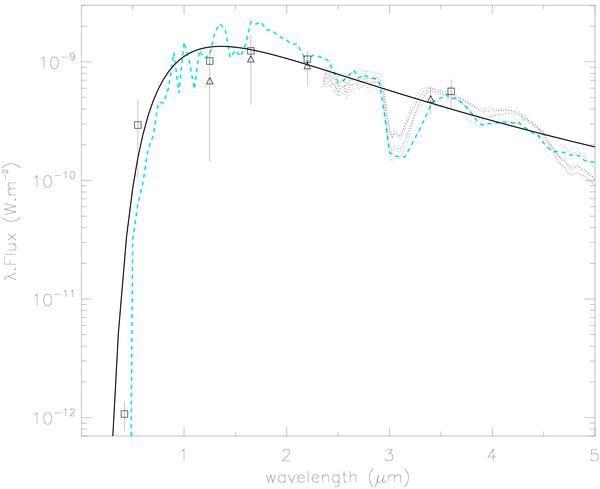
Best-fitting hydrostatic model (blue dashed line) on the spectrophotometric measurements. Photometric measurements (squares: Bagnulo et al. 1998 + triangles: Whitelock et al. 2006; see Table 4) and ISO/SWS spectra of R Scl at different epochs (dotted lines) are shown. A blackbody continuum having the same temperature (Teff = 2700 K) and angular diameter (⊘ ⋆ = 10.2 mas) as the synthetic COMARCS spectrum is superimposed (black solid line).
Current usage metrics show cumulative count of Article Views (full-text article views including HTML views, PDF and ePub downloads, according to the available data) and Abstracts Views on Vision4Press platform.
Data correspond to usage on the plateform after 2015. The current usage metrics is available 48-96 hours after online publication and is updated daily on week days.
Initial download of the metrics may take a while.