Fig. 3
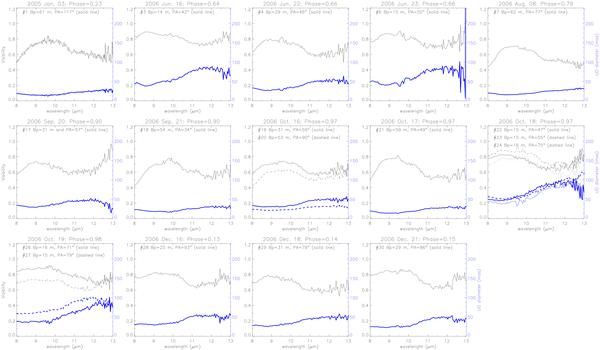
Spectrally-dispersed MIDI visibilities of R Scl (black thin lines to be read from the scale on the left axis) observed over 14 nights between January 2005 and December 2006 (see Tables 2 and 3). Uniform disk diameters (blue thick lines to be read from the scale on the right axis) are computed from the visibilities at each spectral channel. Error bars are not included for clarity. The data set numbers are defined in Tables 2 and 3.
Current usage metrics show cumulative count of Article Views (full-text article views including HTML views, PDF and ePub downloads, according to the available data) and Abstracts Views on Vision4Press platform.
Data correspond to usage on the plateform after 2015. The current usage metrics is available 48-96 hours after online publication and is updated daily on week days.
Initial download of the metrics may take a while.