Free Access
Fig. 3
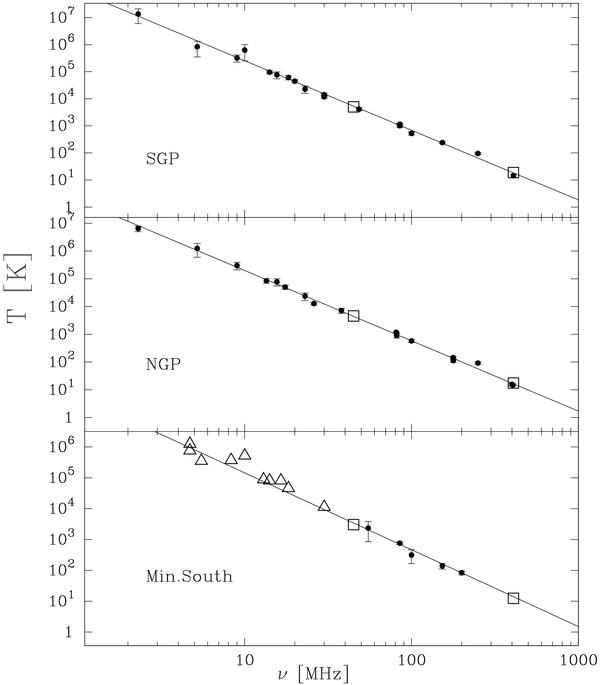
Multi-frequency spectra of the Galactic component for (from top to bottom): south Galactic Pole, North Galactic Pole, and minimum-south zones. The triangles are not considered in the least squares fitting of the line. The squares represent the 45 and 408 MHz data.
Current usage metrics show cumulative count of Article Views (full-text article views including HTML views, PDF and ePub downloads, according to the available data) and Abstracts Views on Vision4Press platform.
Data correspond to usage on the plateform after 2015. The current usage metrics is available 48-96 hours after online publication and is updated daily on week days.
Initial download of the metrics may take a while.