Fig. 7
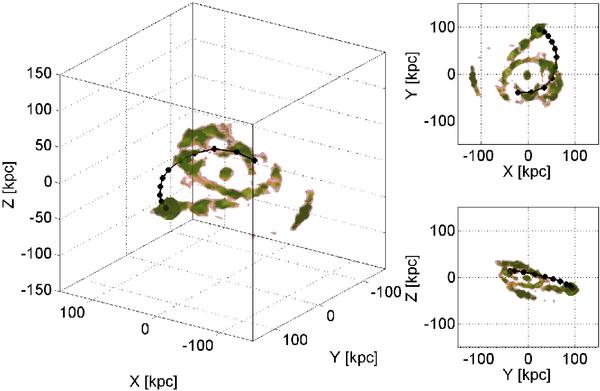
N-body representation of the evolved galaxy. The classical point representation has been substituted with an 3D isocontour plot by counting the amount of stars within a 3D grid spanning the whole configuration space of the orbit and joining cells with equal number of stars. The green isocontours show overdensities of 1/104 and the purple for overdensities of 1/103.
Current usage metrics show cumulative count of Article Views (full-text article views including HTML views, PDF and ePub downloads, according to the available data) and Abstracts Views on Vision4Press platform.
Data correspond to usage on the plateform after 2015. The current usage metrics is available 48-96 hours after online publication and is updated daily on week days.
Initial download of the metrics may take a while.