Fig. 5
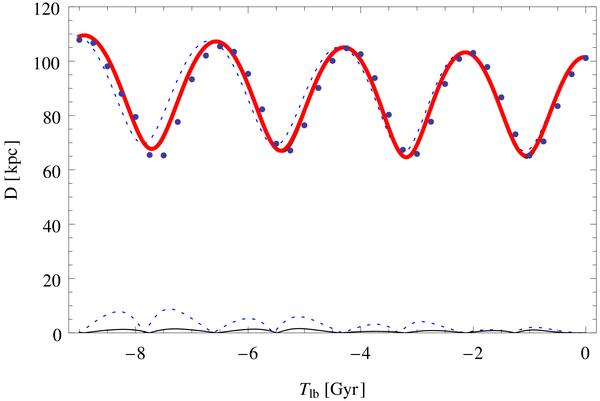
Radial distance evolution test. Comparing the N-body simulation (black dots) and the point-mass integration (solid red line). The dashed line represents the integration without the bulge mentioned in Sect. 2.5. The lines at the bottom represent the difference between the red line and the dashed line, while the solid black line represents the difference between the red line and the orbit computed considering the dynamical friction (see text for details and Sect. 2.5).
Current usage metrics show cumulative count of Article Views (full-text article views including HTML views, PDF and ePub downloads, according to the available data) and Abstracts Views on Vision4Press platform.
Data correspond to usage on the plateform after 2015. The current usage metrics is available 48-96 hours after online publication and is updated daily on week days.
Initial download of the metrics may take a while.