Fig. 11
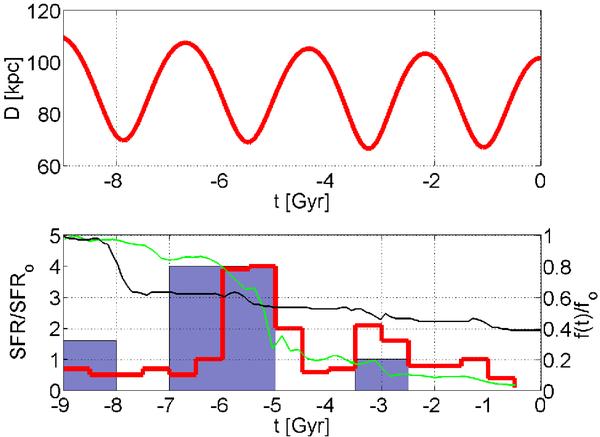
Star formation rate (SFR) as a function of time normalized to the maximum of the
observed SFR (SFRo).
The upper panel shows the radial distance of the N-body system to
the origin of the reference system centered on the MW’s barycentre for the
best-fitting orbit. The lower panel shows the star formation triggered by the
pericentre passages and we report the profile of SFR as deduced in Rizzi et al. (2003). In the lower panel thin
green and black lines refer to the gas and bound mass fraction normalized to the
initial value ( on the right
vertical axis).
on the right
vertical axis).
Current usage metrics show cumulative count of Article Views (full-text article views including HTML views, PDF and ePub downloads, according to the available data) and Abstracts Views on Vision4Press platform.
Data correspond to usage on the plateform after 2015. The current usage metrics is available 48-96 hours after online publication and is updated daily on week days.
Initial download of the metrics may take a while.