Fig. 11
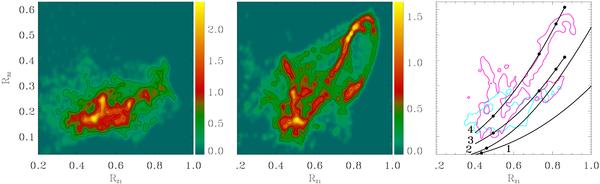
(Left) R32-vs.-R21 diagram for the galaxy NGC 4569. The x-axis represents R21 and the y-axis R32. The intensity scale gives the sky area in the map per unit area in the ratio space, it is expressed in beams per 0.01 × 0.01 ratio area. This diagram has been produced by convolving the actual distribution of pixels in the ratio-ratio plane by a Gaussian kernel with a FWHM of 0.02. Note that the pixels in the ratio maps used to compute the distribution are much smaller than the beam (see Sect. 4). The contour levels are 0.3, 0.6, 0.9, 1.2 and 1.5 beams/0.012. (Middle) R32-vs.-R21 diagram for the galaxy NGC 4826; the contour levels are 0.3, 0.5, 0.7, 0.9, 1.1 beams/0.012. (Right)LTE and pseudo-LTE models represented as black curves in the R32-vs.-R21 diagram. Curves 1 and 2 correspond to pure LTE models with NCO/dV = 1015 cm-2 pc (km s-1)-1 and NCO/dV = 12 × 1015 cm-2 pc (km s-1)-1, respectively. The temperature increases from 4 K at the bottom left to 8 K at the top right. Curves 3 and 4 correspond to pseudo-LTE models with f32 = 0.5 and f32 = 0.2 respectively (see Sect. 5.1 for the definition of f32). The column density to line width ratio is NCO/dV = 1015 cm-2 pc (km s-1)-1 and the temperature increases from 4 to 20 K along the curves from bottom left to top right. The cyan and magenta curves show the lowest contours for NGC 4569 and NGC 4826, respectively.
Current usage metrics show cumulative count of Article Views (full-text article views including HTML views, PDF and ePub downloads, according to the available data) and Abstracts Views on Vision4Press platform.
Data correspond to usage on the plateform after 2015. The current usage metrics is available 48-96 hours after online publication and is updated daily on week days.
Initial download of the metrics may take a while.