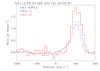
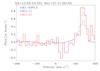
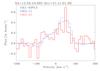
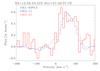
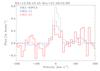
Fig. 8
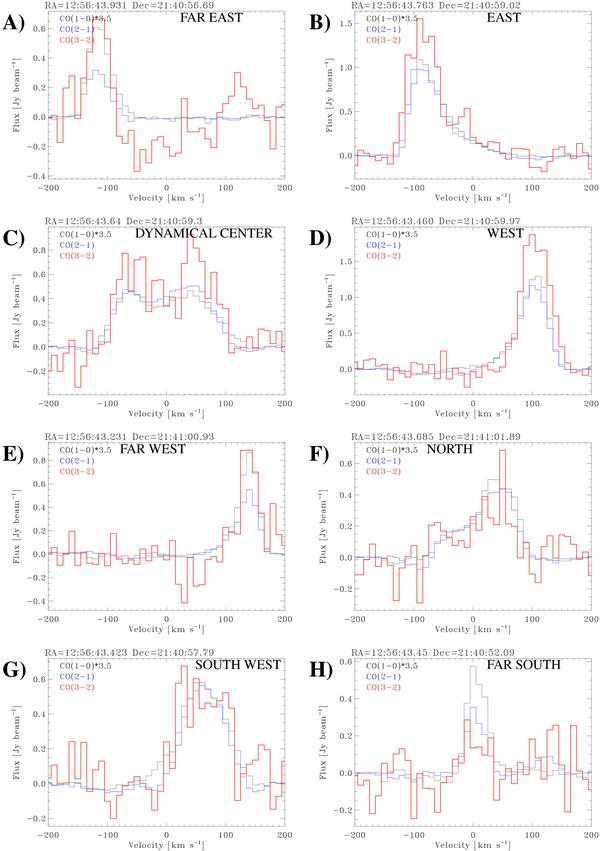
Individual spectra of the CO(1–0) line (black), the CO(2–1) line (blue) and the CO(3–2) line (red) at 8 different positions (see Fig. 6) in the central region of NGC 4826 extracted at the same spatial resolution of 2.6″ × 1.9″. The fluxes have been corrected for primary beam attenuation and the CO(1–0) flux is scaled up by a factor 3.5 for better readability.
Current usage metrics show cumulative count of Article Views (full-text article views including HTML views, PDF and ePub downloads, according to the available data) and Abstracts Views on Vision4Press platform.
Data correspond to usage on the plateform after 2015. The current usage metrics is available 48-96 hours after online publication and is updated daily on week days.
Initial download of the metrics may take a while.